
TL;DR
TrakSYS dashboards transform real-time production data into clear, role-specific insights. Specific to your operation and use case, TrakSYS dashboards provide the visibility needed to reduce waste, improve performance, and drive continuous improvement.
Key takeaways:
- Real-time visibility drives action: Dashboards visualize current performance against historical trends, enabling faster, more informed decisions.
- Role-based dashboards matter: Operators, supervisors, and executives need to monitor different KPIs to act effectively in their position.
- Dashboards span critical use cases: OEE, quality, downtime, maintenance, inventory, scheduling, energy, and daily production reporting, all benefit from visual insights.
- Better visuals reduce guesswork: Clear, contextual dashboards help teams focus on root causes rather than react to symptoms.
- MES data adds operational context: Integrating shop-floor data from machines, systems, and workflows makes dashboards truly actionable.
Modern manufacturing generates an overwhelming amount of data, but that data only proves valuable once an organization can act on it.
Traditionally, manufacturing plants have relied on delayed, manually compiled reports or intuition for critical decision-making, and many still do. However. That approach is no longer sustainable or necessary with today’s fast-paced, data-driven innovations.
This is where TrakSYS dashboards come in. Our MES platform can synthesize raw data from the factory floor and across the enterprise into role-specific, real-time insights. TrakSYS dashboards are purpose-built to help empower decision-makers across your enterprise to respond faster, reduce waste, and drive measurable improvements.
This piece reviews eight high-impact dashboards made possible with TrakSYS: what they track, why they matter, and who benefits from them.
What Makes an Effective Dashboard?
Not all dashboards are created equal; the best are built on these key principles:
- Real-Time & Historical Data
Dashboards should reflect what’s happening right now, as well as compare that information against historical data to detect trends and deviations.
- Role-Specific Views
A production manager doesn’t need the same data as a quality engineer. Dashboard views must align with each user’s specific role.
- Actionable Metrics
Vanity metrics can’t be the primary focus. Dashboards should prioritize meaningful KPIs that trigger action.
- Drill-down Capability
Alerts are most useful when users can trace them from overview down to root cause.
- Visual Clarity
Dashboards must be clear and understandable at a glance, even on small shop floor displays.
- Integrated Data Sources
Integrating data from PLCs, MES, ERP, IIoT devices, and manual inputs is essential for creating unified views.
With these principles in mind, let’s look at how TrakSYS delivers with these powerful dashboards:
Dashboard #1: Overall Equipment Effectiveness (OEE)
This dashboard gives users a single, unified view of equipment productivity by aggregating availability, performance, and quality into one key metric: OEE. This dashboard is a cornerstone of any continuous improvement initiative, enabling users to pinpoint where losses are occurring, such as unplanned downtime, slow cycles, or scrap.
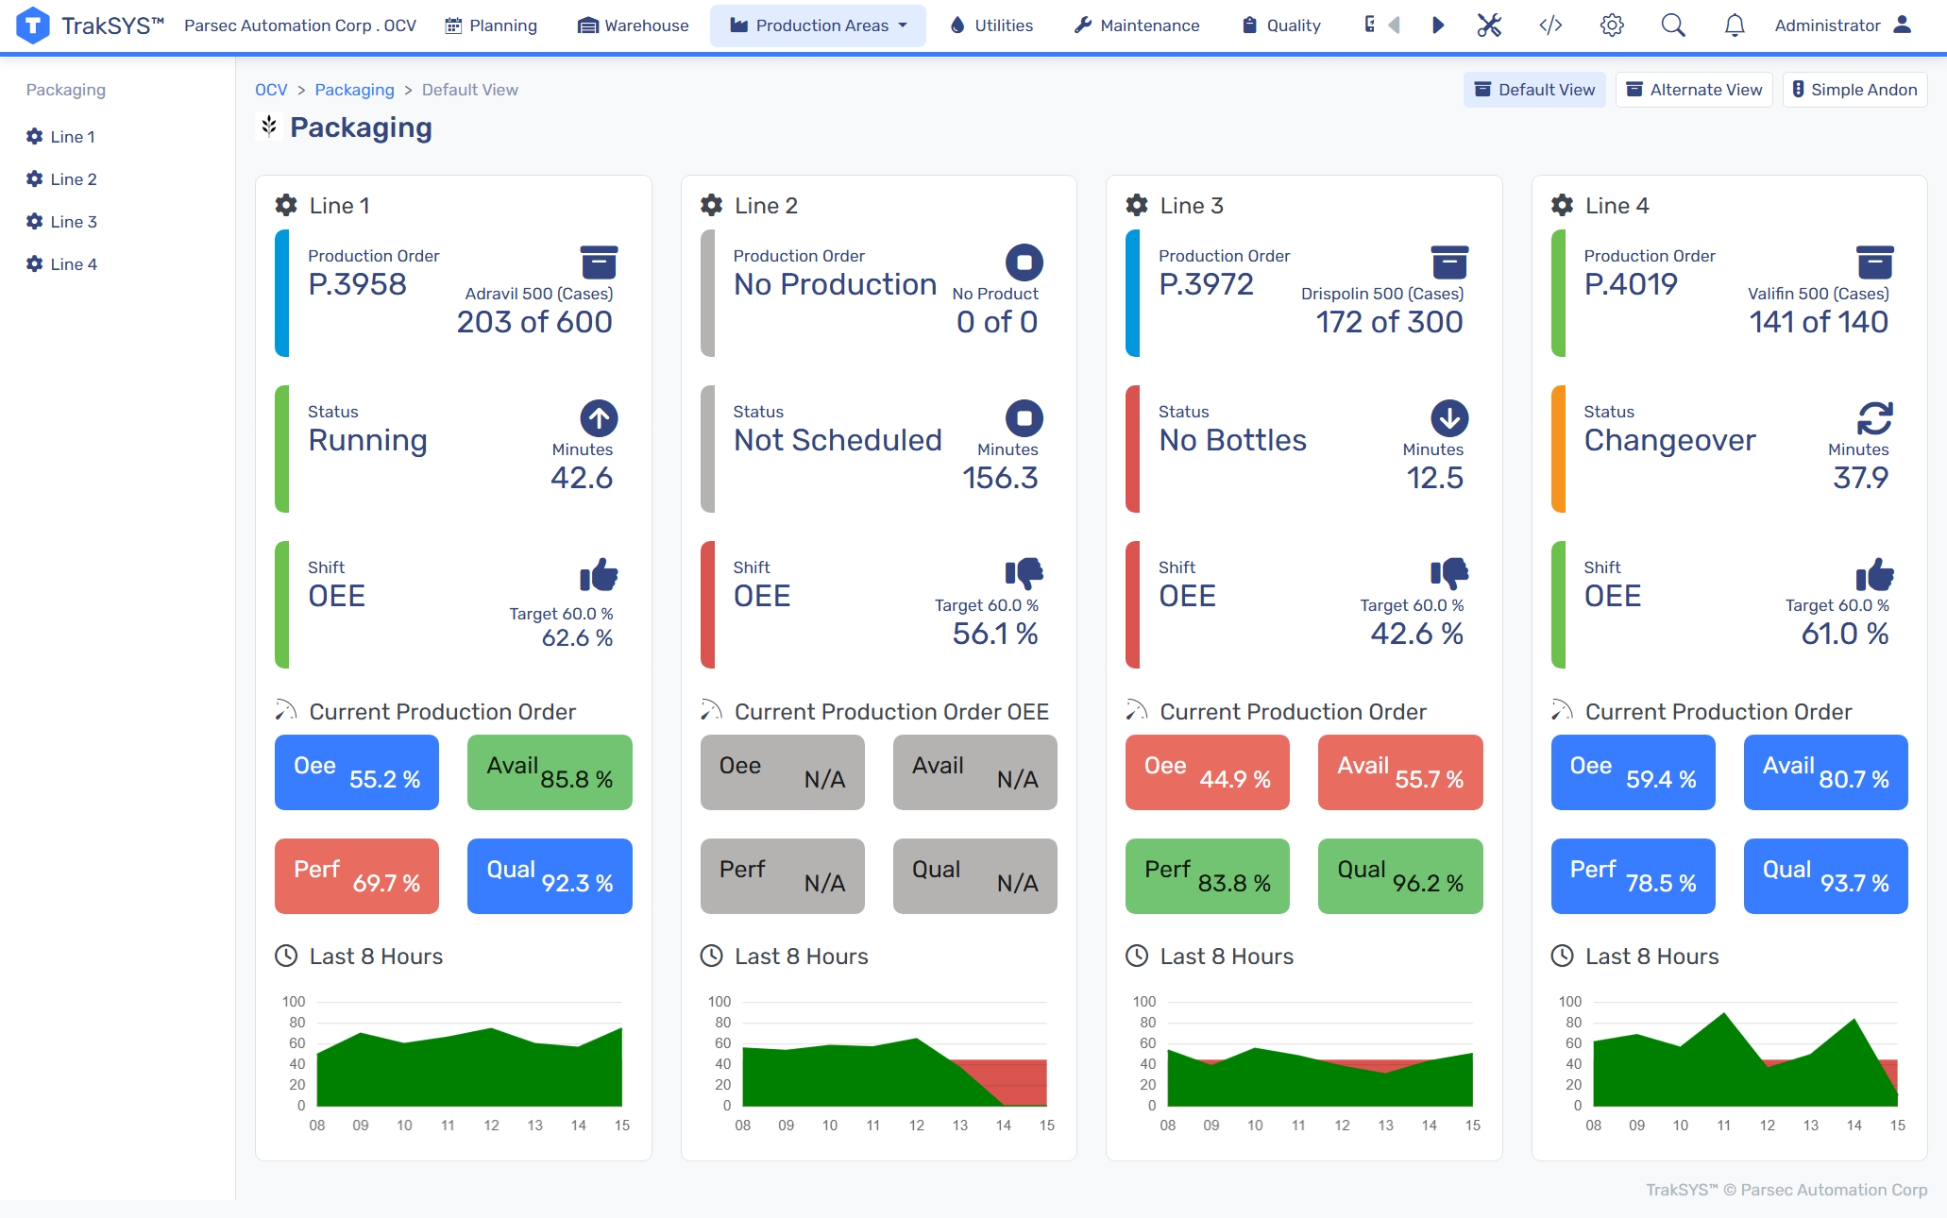
What it Tracks:
- OEE (Availability x Performance x Quality)
- Availability (Scheduled vs. actual runtime)
- Performance (Ideal vs. actual cycle times)
- Quality (Good parts vs. total output)
Who it’s For:
- Production managers optimizing performance
- Maintenance teams monitoring machine health
- Operators tracking line-level efficiencies in real-time
Dashboard #2: Quality Control
TrakSYS enables near real-time monitoring of quality metrics with statistical process control (SPC) variations. This dashboard enables users to identify defects early and intervene before problems escalate. It also supports compliance through detailed traceability and audit-ready documentation.
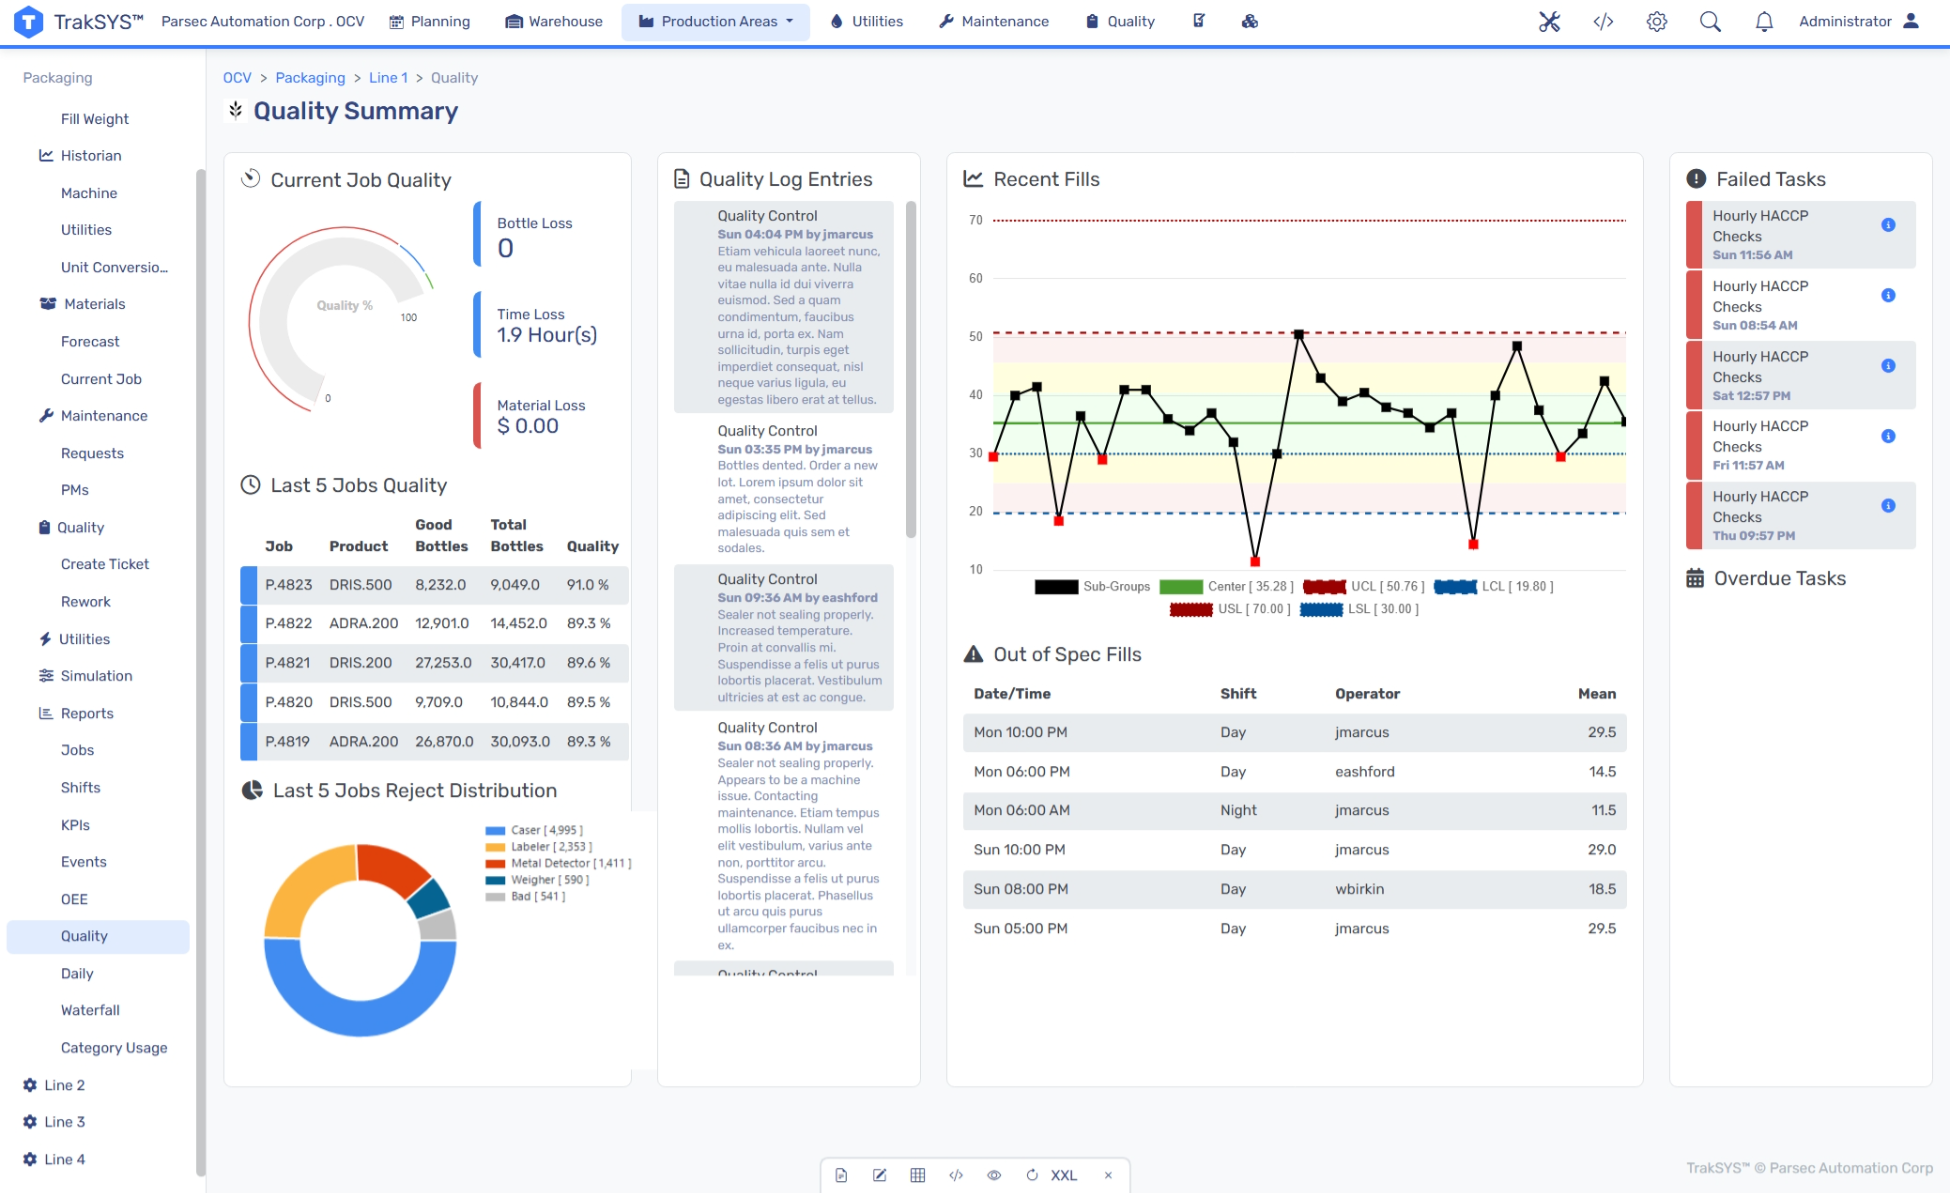
What it Tracks:
- First Pass Yield (FPY)
- Defects Per Million Opportunities (DPMO)
- Scrap rate (Material waste percentage)
Who it’s For:
- Quality Assurance (QA) teams monitoring compliance
- Process engineers identifying trends
- Regulatory teams preparing audits
Dashboard #3: Maintenance & Reliability
This dashboard empowers predictive maintenance strategies. Instead of reacting to breakdowns, maintenance teams can use TrakSYS to monitor condition-based indicators and respond before failures occur. Dashboard analytics show trends over time and help prioritize maintenance backlogs.
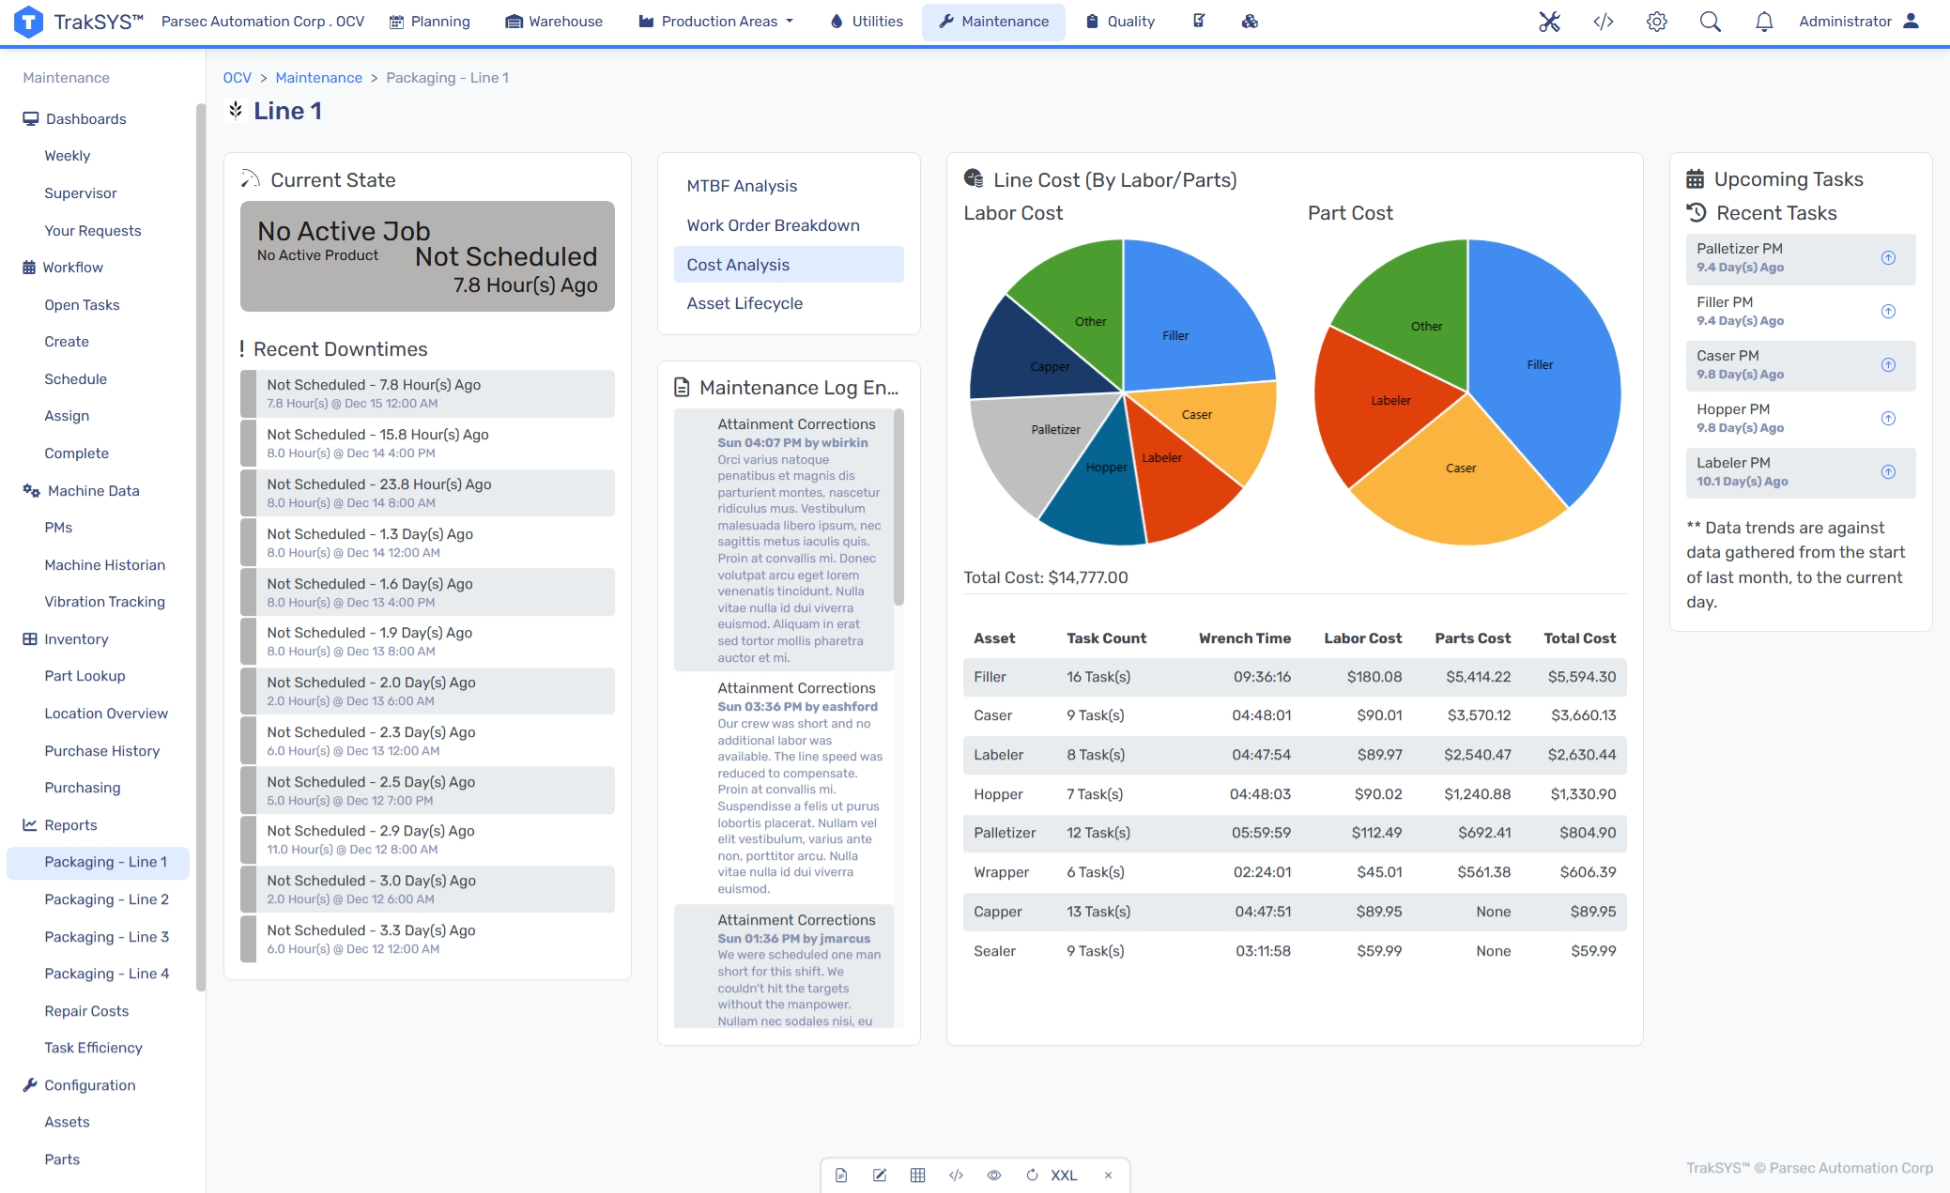
What it Tracks:
- Mean Time Between Failures (MTBF)
- Mean Time to Repair (MTTR)
- Planned vs. unplanned work
- Machine condition indicators
- Maintenance backlog
Who it’s For:
- Maintenance managers optimizing schedules
- Reliability engineers identifying failure patterns
- Procurement teams planning spare parts inventory
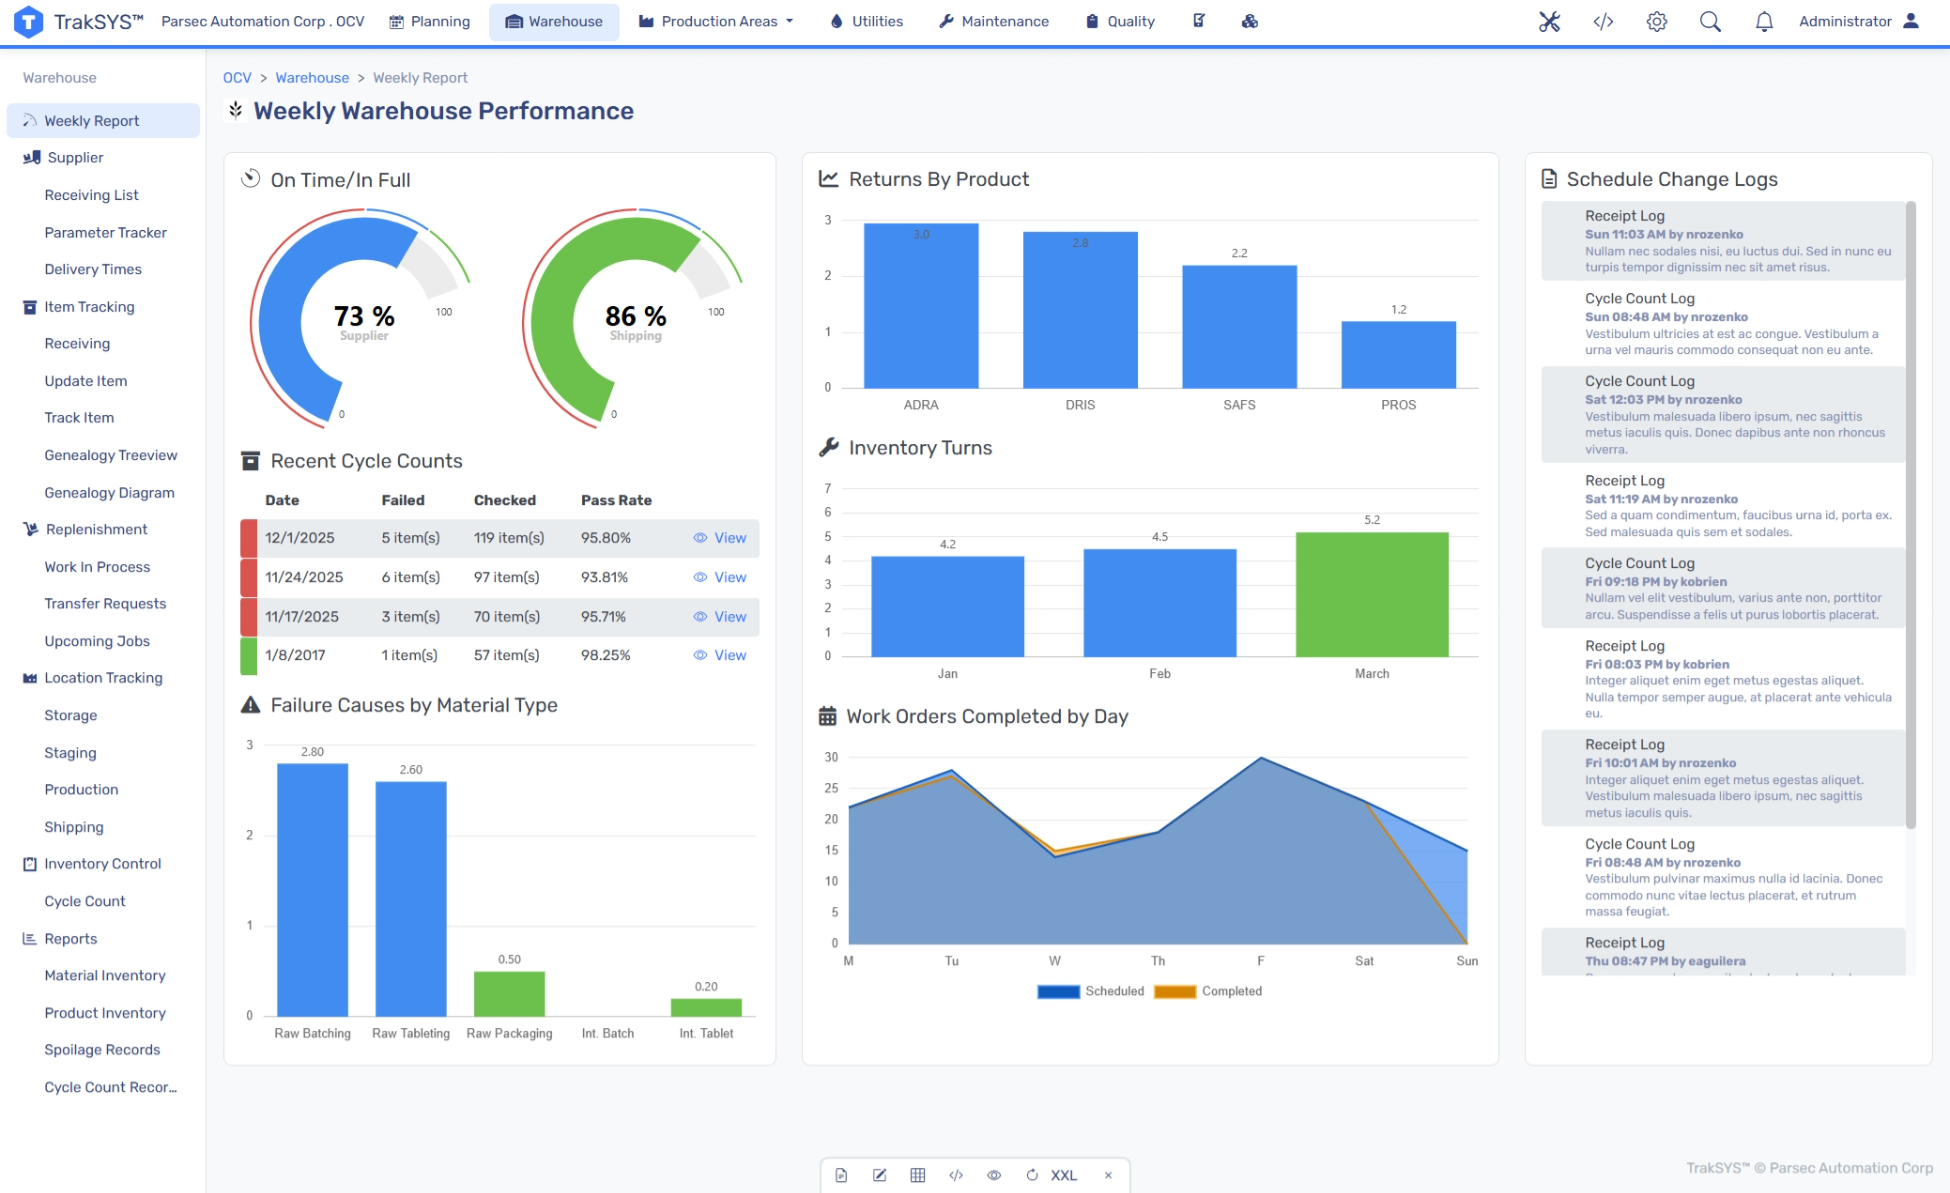
Dashboard #4: Inventory & Materials
TrakSYS helps manufacturers inventory management practices like JIT and JIC without sacrificing visibility. This dashboard provides a holistic view of material flow, Work in Process (WIP), and supplier performance, all in one place. It also supports traceability by linking raw material lots to final products.

What it Tracks:
- Inventory turnover ratio
- days on hand
- WIP levels
- On-Time-in-Full (OTIF) from suppliers
- Material traceability
Who it’s For:
- Supply chain managers optimizing orders
- Production planners ensuring material availability
- Quality teams tracing defects to source lots
Dashboard #5: Downtime Analysis
Go beyond basic downtime tracking with TrakSYS capabilities that break down production halts by reason, line, shift, and more. This dashboard is designed for root cause analysis, providing the data teams need for continuous improvement.
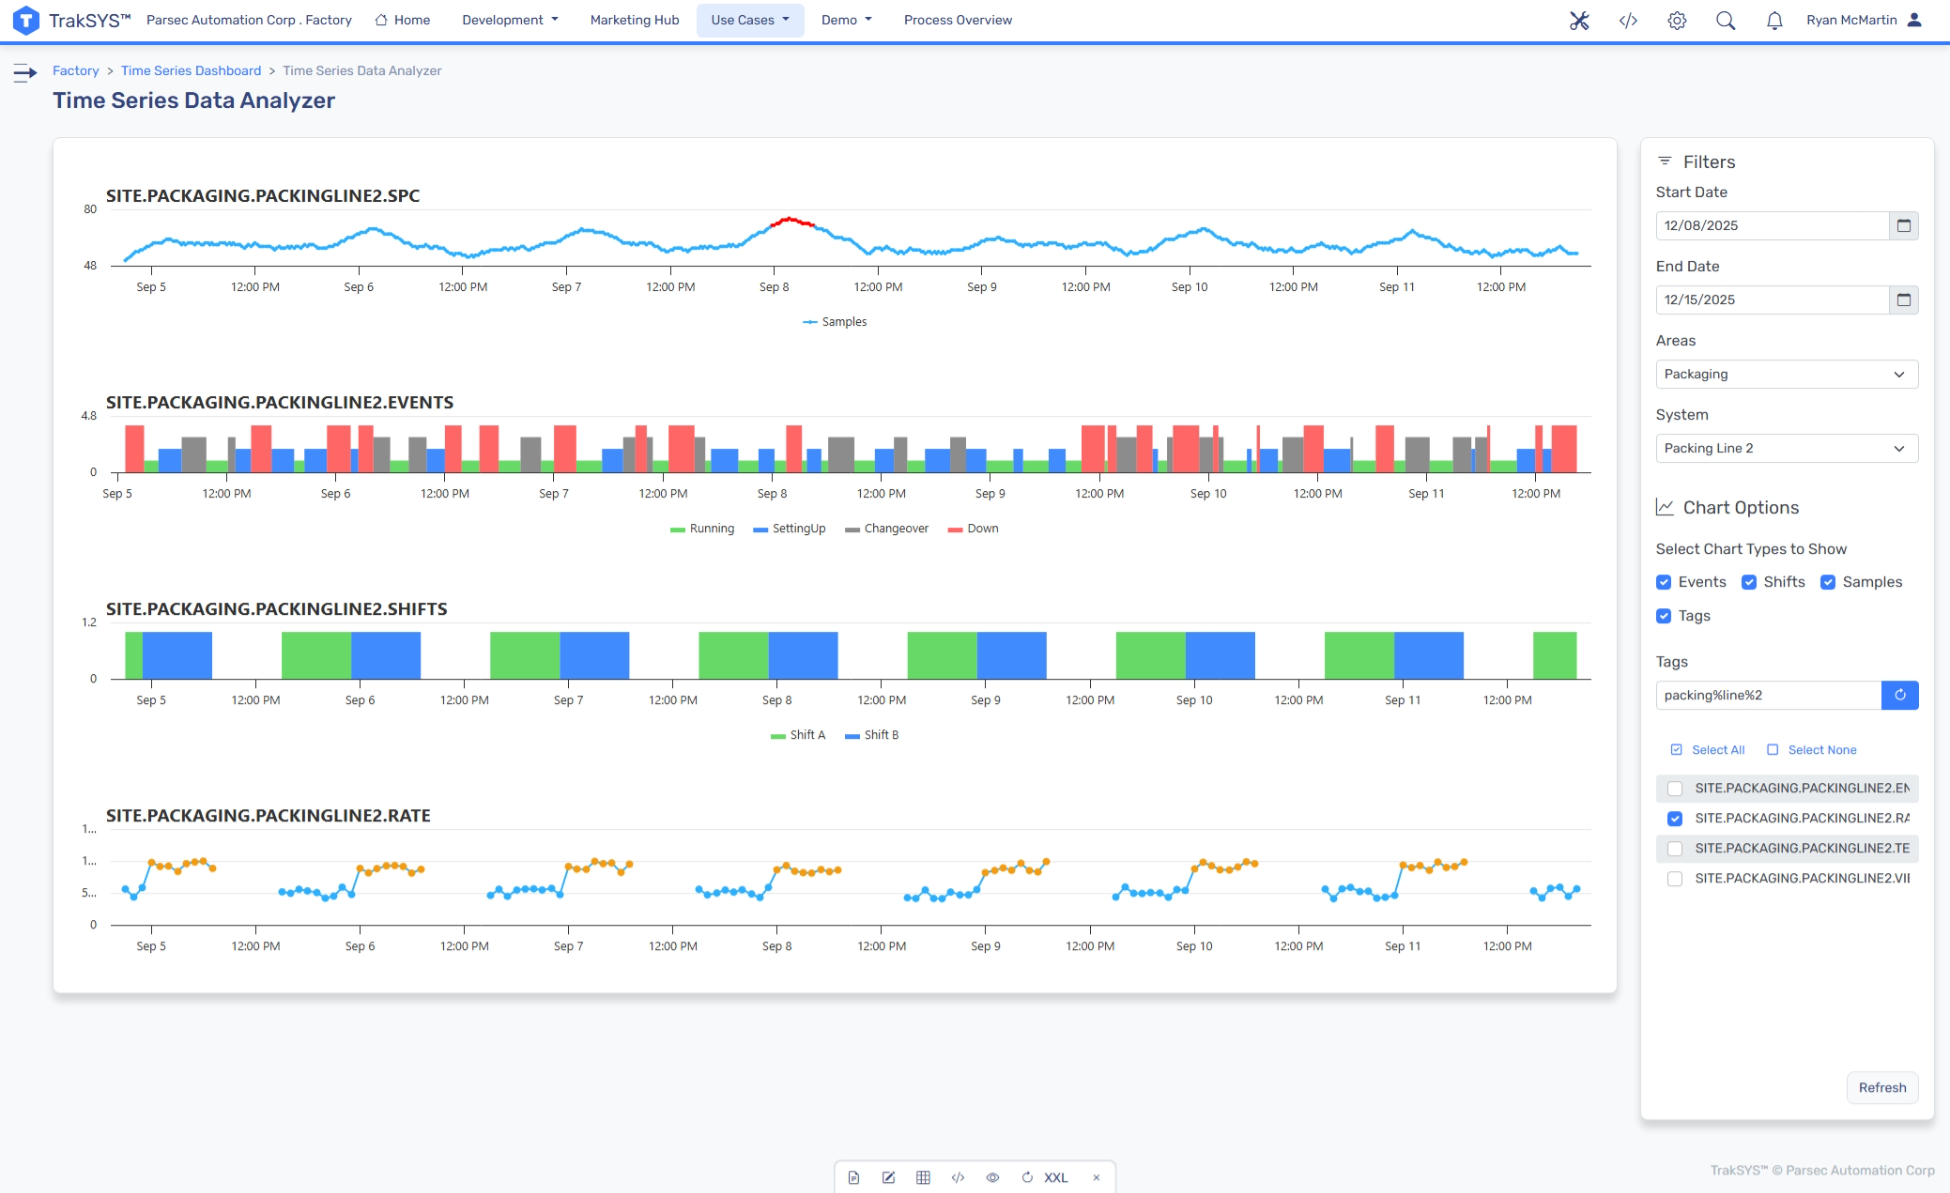
What it Tracks:
- Downtime duration and frequency
- Downtime by reason code (mechanical, material shortage, changeover, etc.)
- Downtime by machine, line, or shift
- Top loss contributors (Pareto analysis)
Who it’s For:
- Continuous Improvement (CI) teams targeting losses
- Maintenance teams focusing on reliability efforts
- Executives calculating opportunity costs
Dashboard #6: Energy Management
This dashboard tracks energy usage by machine, department, and shift. These filters help teams understand their energy consumption, enabling them to make adjustments that reduce costs and improve sustainability. With TrakSYS, manufacturers can align energy expenditure with production output to avoid costly energy spikes.
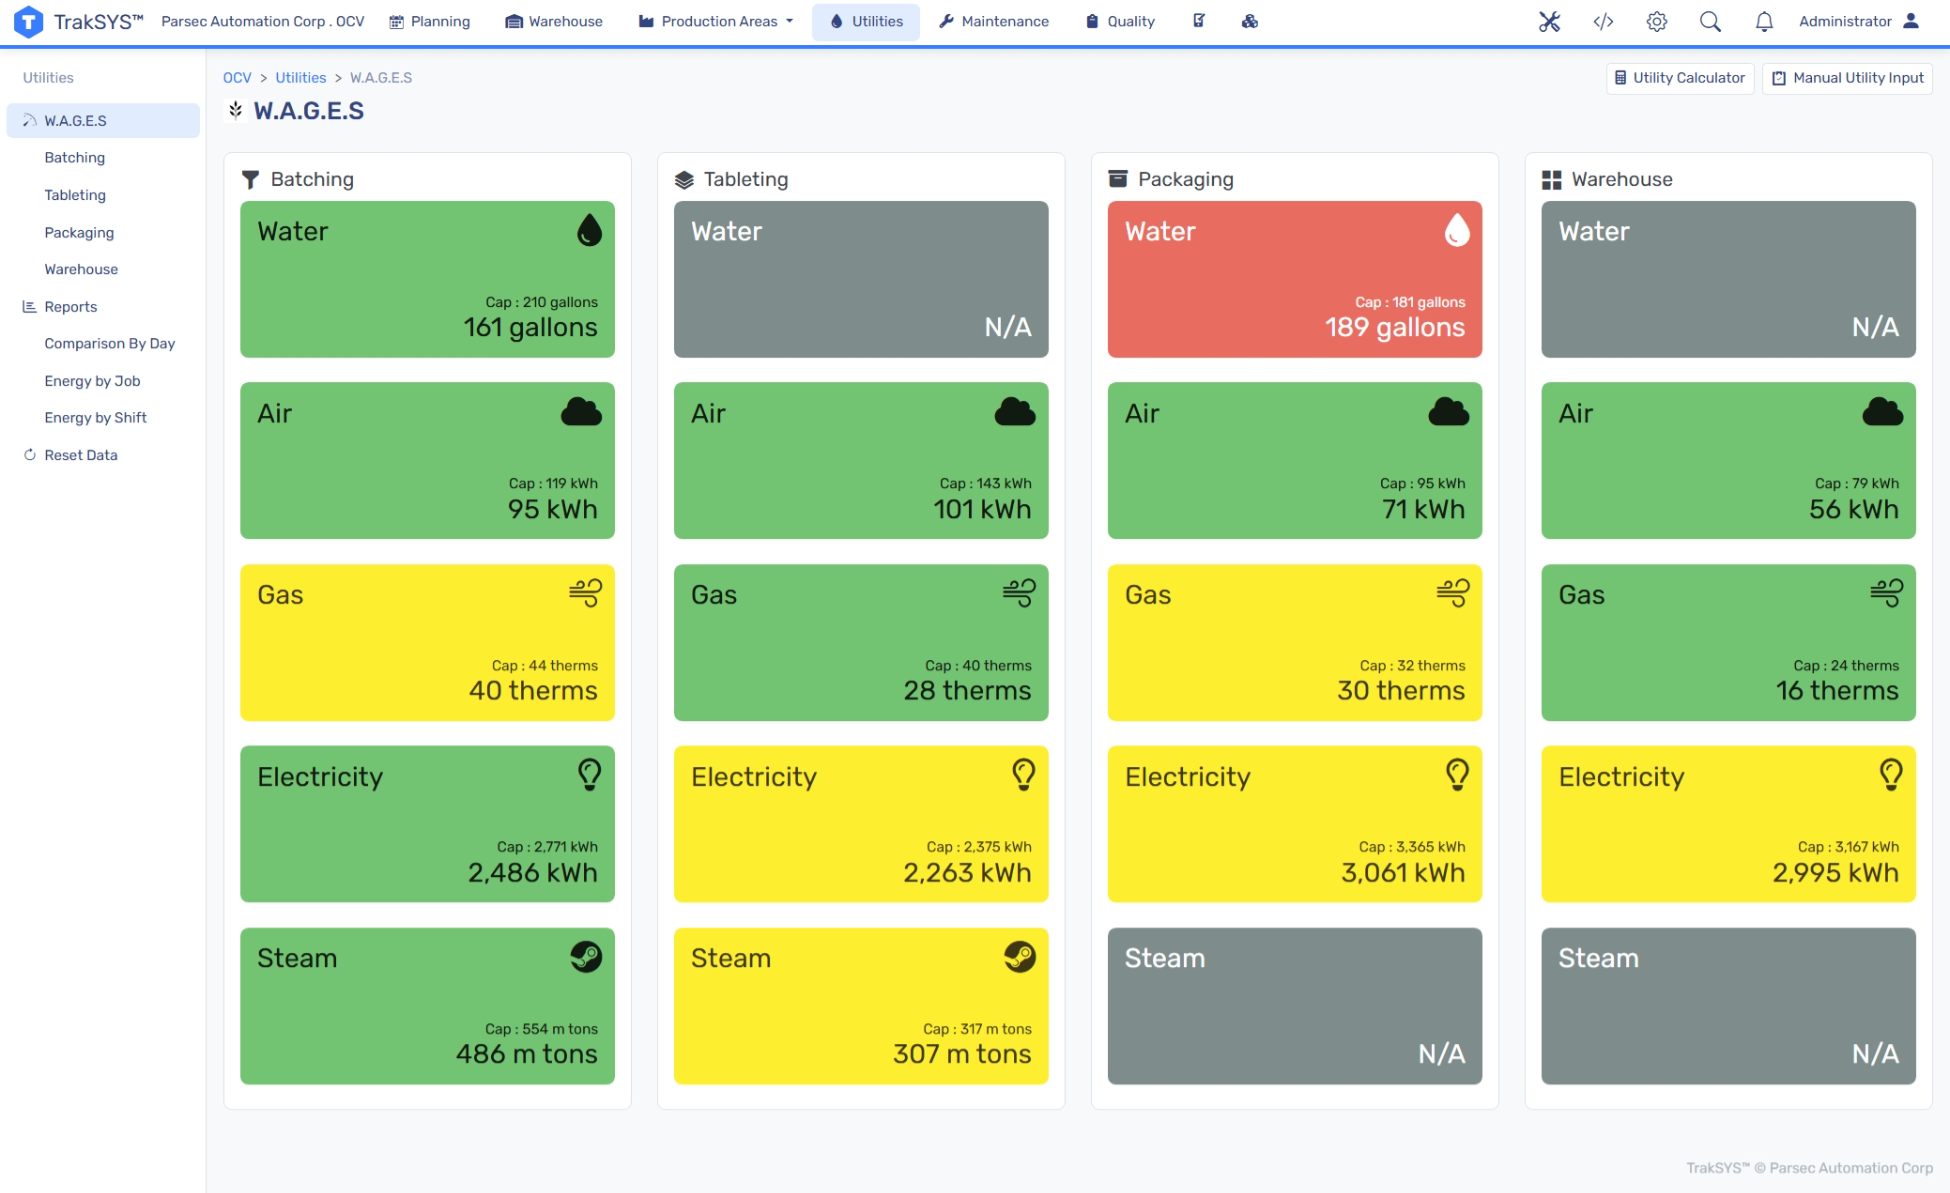
What it Tracks:
- Energy used per machine
- Energy cost per unit produced
- Peak demand monitoring
Who it’s For:
- Plant managers identifying waste
- Sustainability officers tracking environmental goals
- Finance teams reducing operational costs
Dashboard #7: Daily Production Summary
Instead of manually compiling shift reports, TrakSYS automatically generates a comprehensive view of each production day. This dashboard captures everything from output to quality to labor, ensuring comprehensive daily reviews and seamless shift handoffs.
What it Tracks:
- Planned vs. actual output
- OEE
- Quality metrics (FPY, scrap, defect counts)
- Downtime summary
- Labor efficiency
Who it’s For:
- Shift supervisors managing handoff documentation
- Plant managers reviewing daily assessments
- Operations leaders comparing facilities
Dashboard #8: Scheduling & Availability
This dashboard manages shared resources and scheduling, which is critical for regulated and high-precision industries that operate in controlled environments and with specialized equipment. TrakSYS provides real-time visibility into asset usage to ensure that there are no machines overbooked or tasks overlooked.
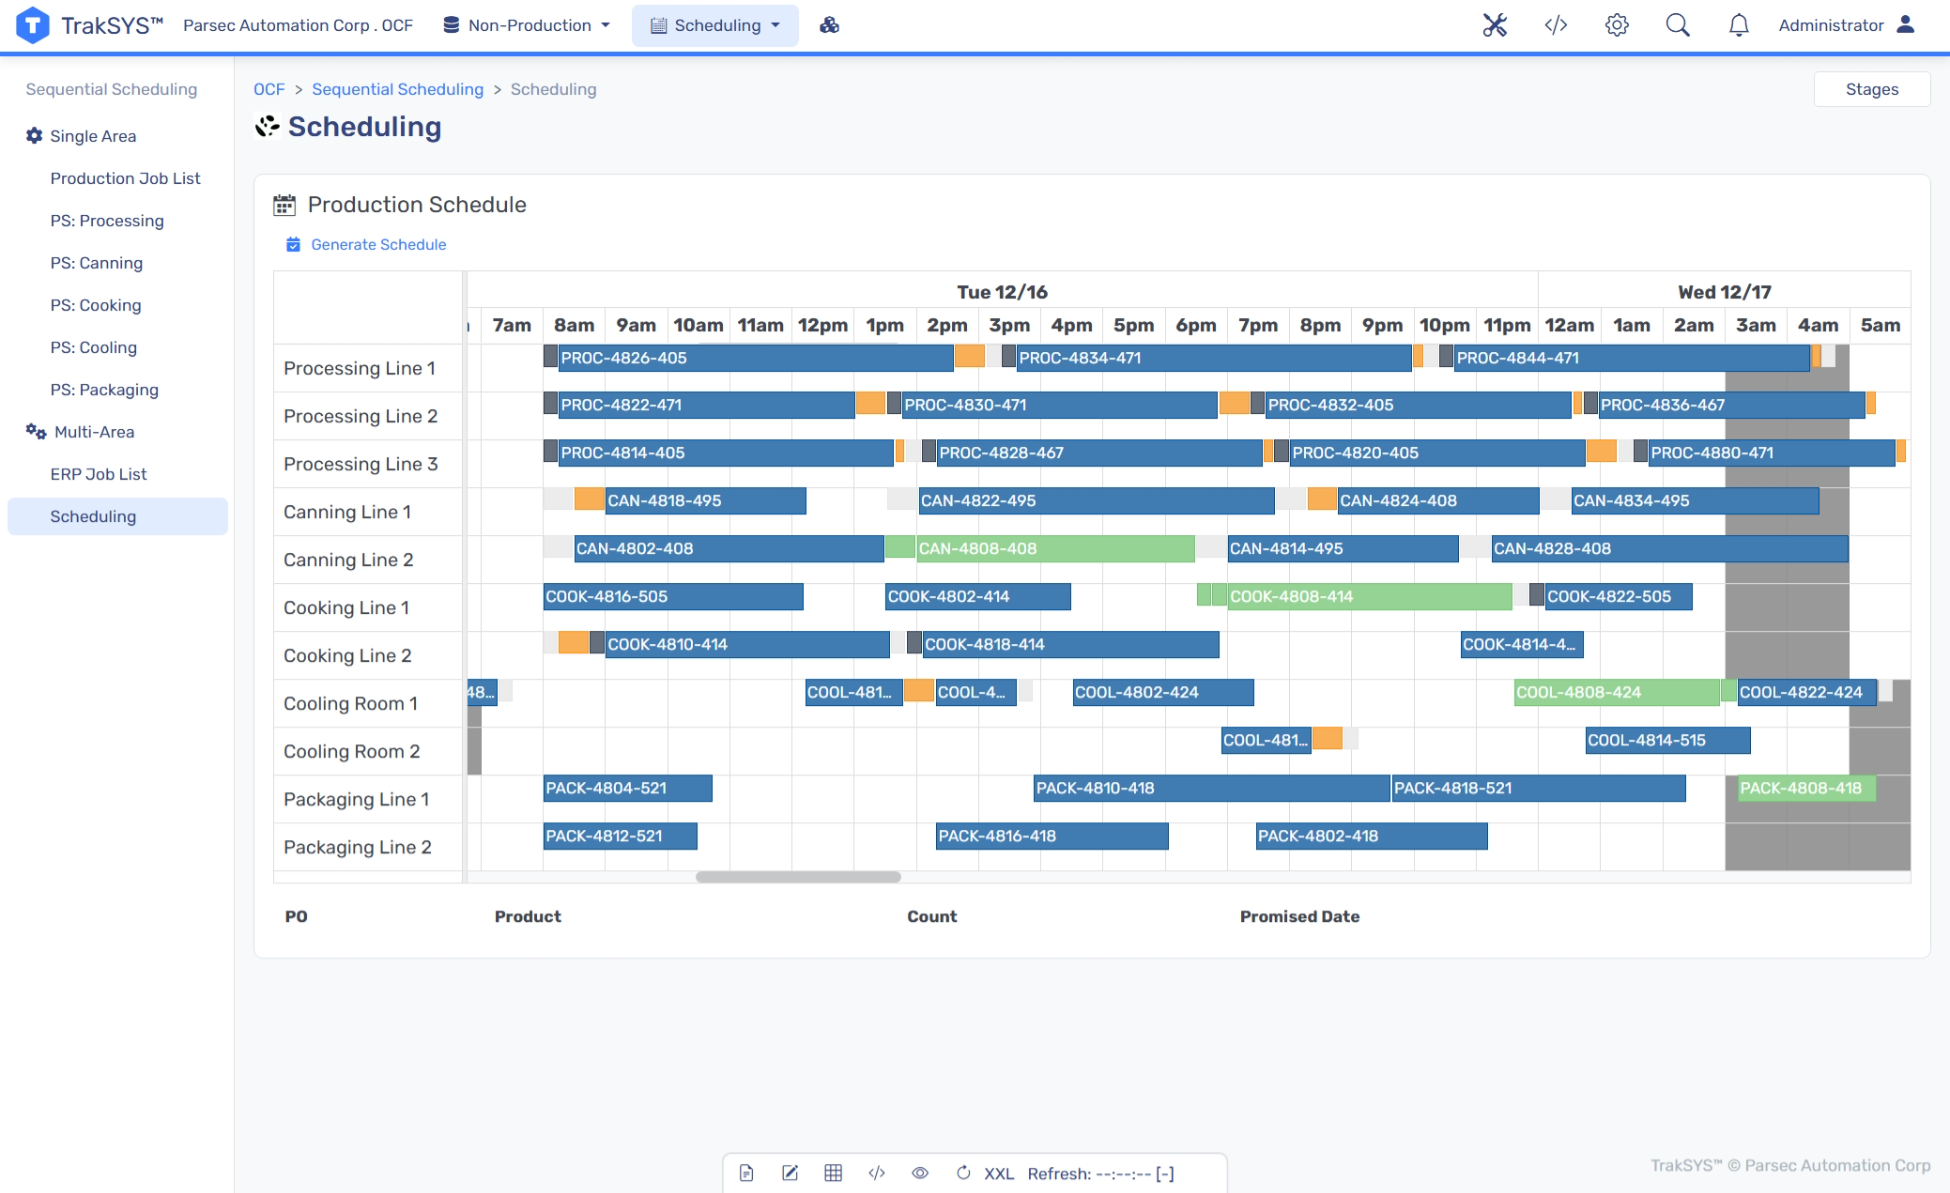
What it Tracks:
- Asset status
- Utilization rate
- Booking schedule
- Turnaround time
- Certification status
Who it’s For:
- Production schedulers optimizing asset allocation
- QA teams ensuring proper cleaning and changeover
- Operations managers maximizing utilization
Conclusion
Dashboards aren’t just about visibility; they’re about impact. TrakSYS dashboards can translate raw manufacturing data into insights that inform action across the enterprise. Whether you’re looking to improve OEE, reduce downtime, or benchmark across sites, the right dashboard can help make it simpler to see what’s happening on the factory floor.
The eight TrakSYS dashboards outlined here represent proven solutions for gaining actionable insights. When implemented with attention to data quality, user roles, and business priorities, these dashboards don’t just visualize performance—they drive it.
Ready to learn more about how TrakSYS can help implement dashboards that turn your operational data into actionable insights? Contact us today.
FAQs
Related Blog Posts


Let’s Build Your Plan
We’ll help you create the right configuration—today and for the future.