


8 Dashboards Life Sciences Manufacturers Need for Regulatory-Ready Production
TL;DR
In life sciences manufacturing, dashboards skew less toward “visibility resource” and more toward “compliance tool”—a missed deviation or overdue calibration can trigger an FDA finding or delay a batch release. These eight purpose-built dashboards give manufacturers real-time, audit-ready visibility into batch quality, deviations, equipment, and environmental conditions.
Key takeaways:
- A dashboard can earn daily use in a regulated environment by combining real-time and historical data, offering role-specific views, and automatically pulling data.
- Dashboards covering RFT, deviations, OEE, and SPC give teams early visibility into quality and process drift before issues become failures.
- Environmental monitoring and asset health dashboards connect equipment and cleanroom conditions directly to product and data integrity.
- Audit readiness and batch release dashboards consolidate documentation, training, and traceability status so teams can best understand their audit readiness.
- Built on real-time data from the shop floor, these dashboards can replace manual reporting and pre-audit scrambling.
Ready to learn more about how TrakSYS dashboards can bring powerful visibility to your life sciences operation? Contact us today.
8 Dashboards Life Sciences Manufacturers Need for Regulatory-Ready Production
Why Dashboards Matter
In most industries, a dashboard is a convenient tool. In life sciences manufacturing, it's closer to a compliance instrument.
A missed deviation, an overdue calibration, or a batch record awaiting a signature isn't just an operational inefficiency—it's the kind of gap that can delay a batch release or show up in an FDA Form 483.
Regulatory compliance, batch quality, operational efficiency, and data integrity are key to visibility in pharmaceutical and biotech manufacturing, and dashboards built for these industries must reflect that from the start.
This piece walks through eight TrakSYS dashboards purpose-built for life sciences production: what they track, who can benefit from them, and why they matter particularly in regulated environments.
What Makes a Dashboard Actually Useful in a Regulated Environment?
Not every dashboard earns a place on a plant floor monitor or a QA manager's homepage. In a regulated environment, a handful of principles separate a dashboard that gets used daily from one that gets ignored shortly after implementation:
- Real-time and historical data displayed together: A dashboard needs to show what's happening right now—an open deviation, a cleanroom excursion, etc.—while also surfacing trends that emerge over weeks or months, such as a slow drift in right-first-time (RFT) rate or a recurring root cause.
- Role-specific views: QA managers, plant supervisors, and validation engineers need different slices of the same underlying data.
- Audit-ready by default: In this industry, "actionable" also means "defensible." A dashboard must be able to hold up if an inspector asks where a number came from.
- Drill down from summary to root cause: A dashboard KPI is most useful when a user can click into it and find the specific batch, line, or deviation driving the number.
- Data pulled automatically, not entered manually: Dashboards built on manually logged data can inherit errors and delays, defeating the primary purpose of a digital dashboard.
With these principles in mind, here’s how eight purpose-built dashboards can be applied in life sciences operations to support audit readiness, production performance, and continuous improvement.
Dashboard #1: Right First Time (RFT)
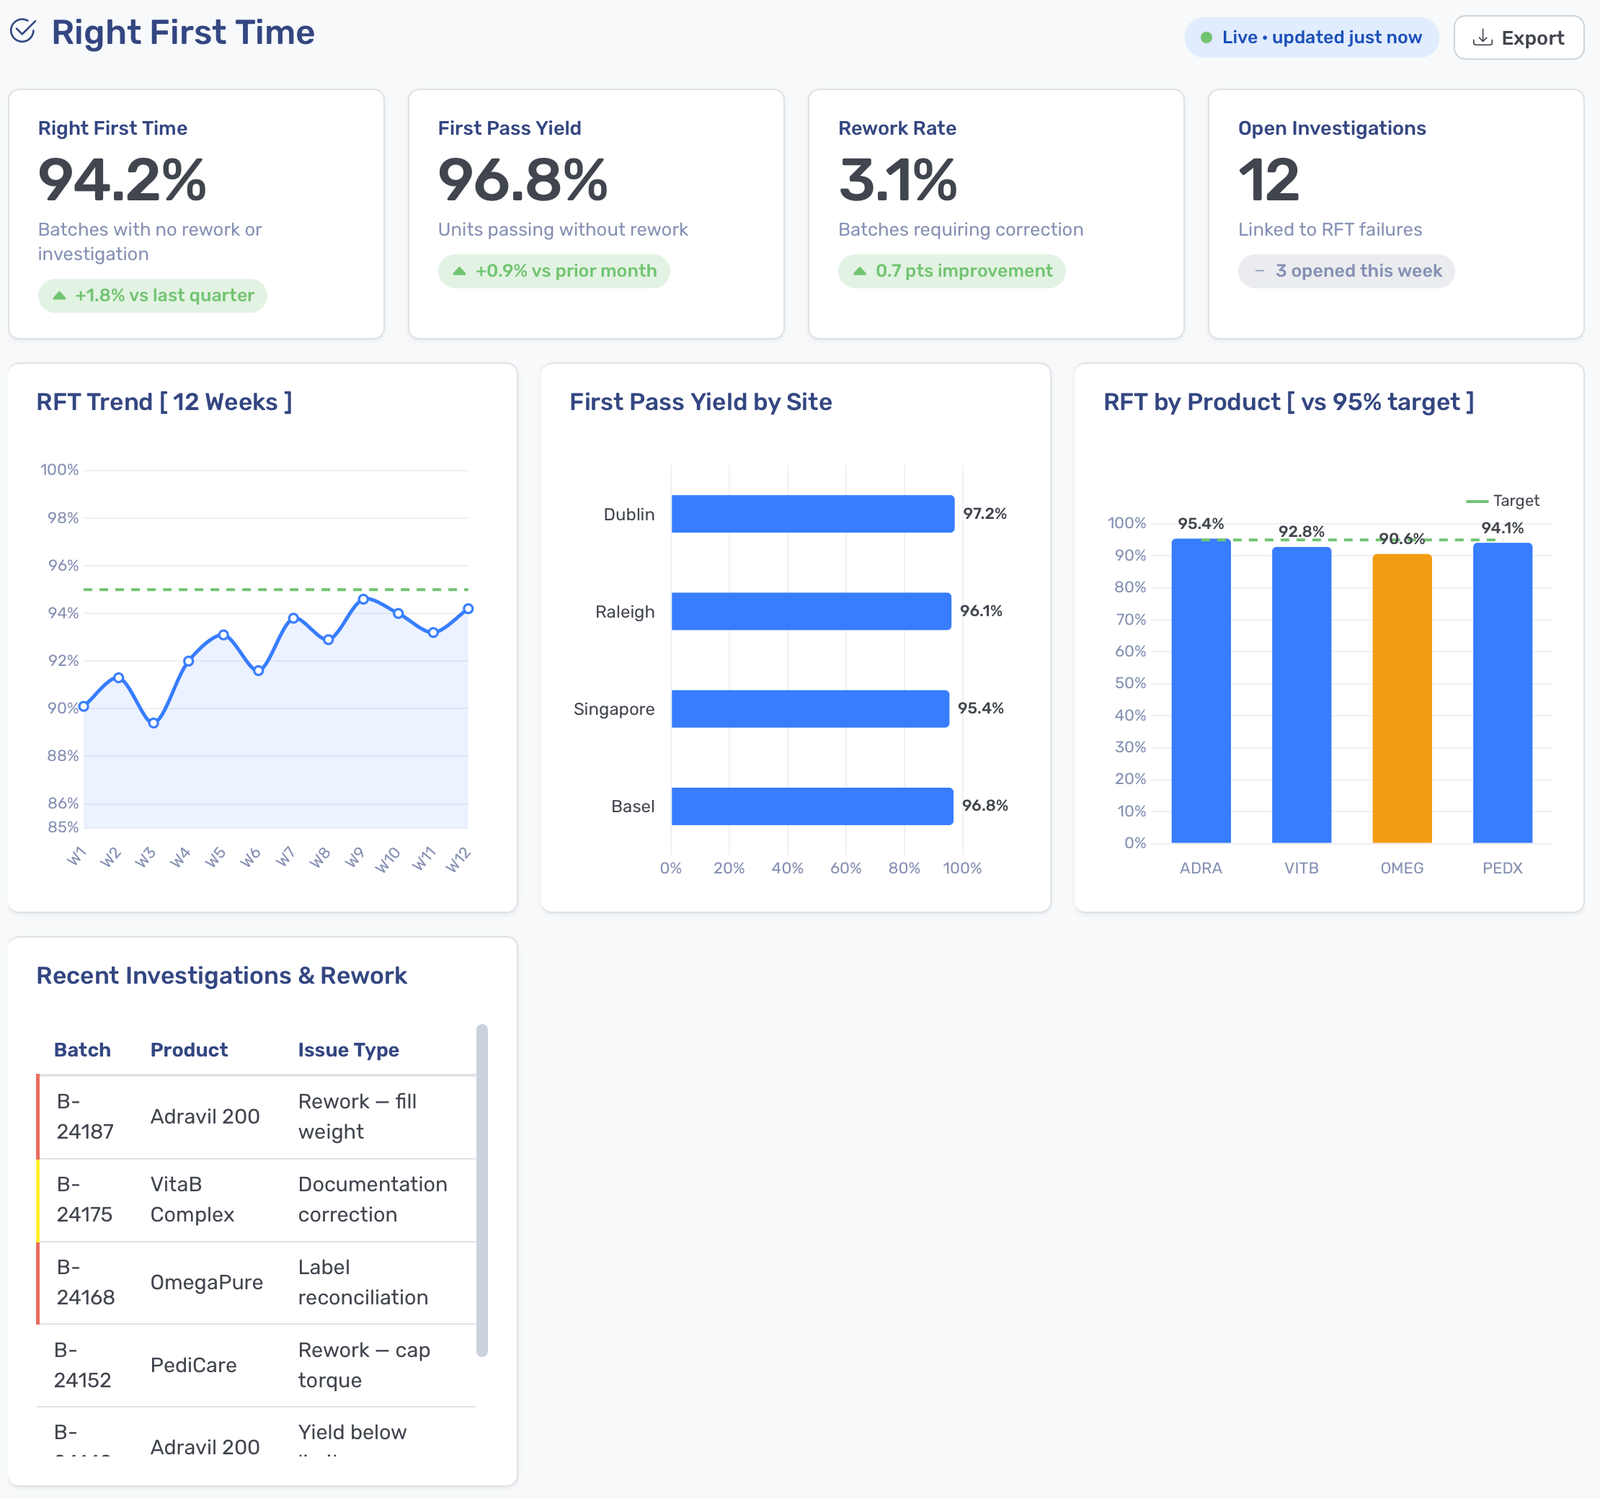
RFT metrics track how often batches are completed successfully without triggering rework, corrective action, or investigation. This is one of the clearest single indicators of process control in a regulated environment because every deviation from "right first time" tends to generate costs in three areas: schedule delays, quality risks, and additional documentation burden.
What it Tracks:
- Overall RFT percentage, first pass yield, and rework rate
- Weekly and monthly RFT trends displayed beside product, site, and shift comparisons
- RFT performance before and after process improvements
Who it’s For:
- Plant managers tracking overall production health
- Quality and process engineers investigating recurring rework
- Continuous improvement teams measuring how an initiative performed
Dashboard #2: Quality Deviation and CAPA
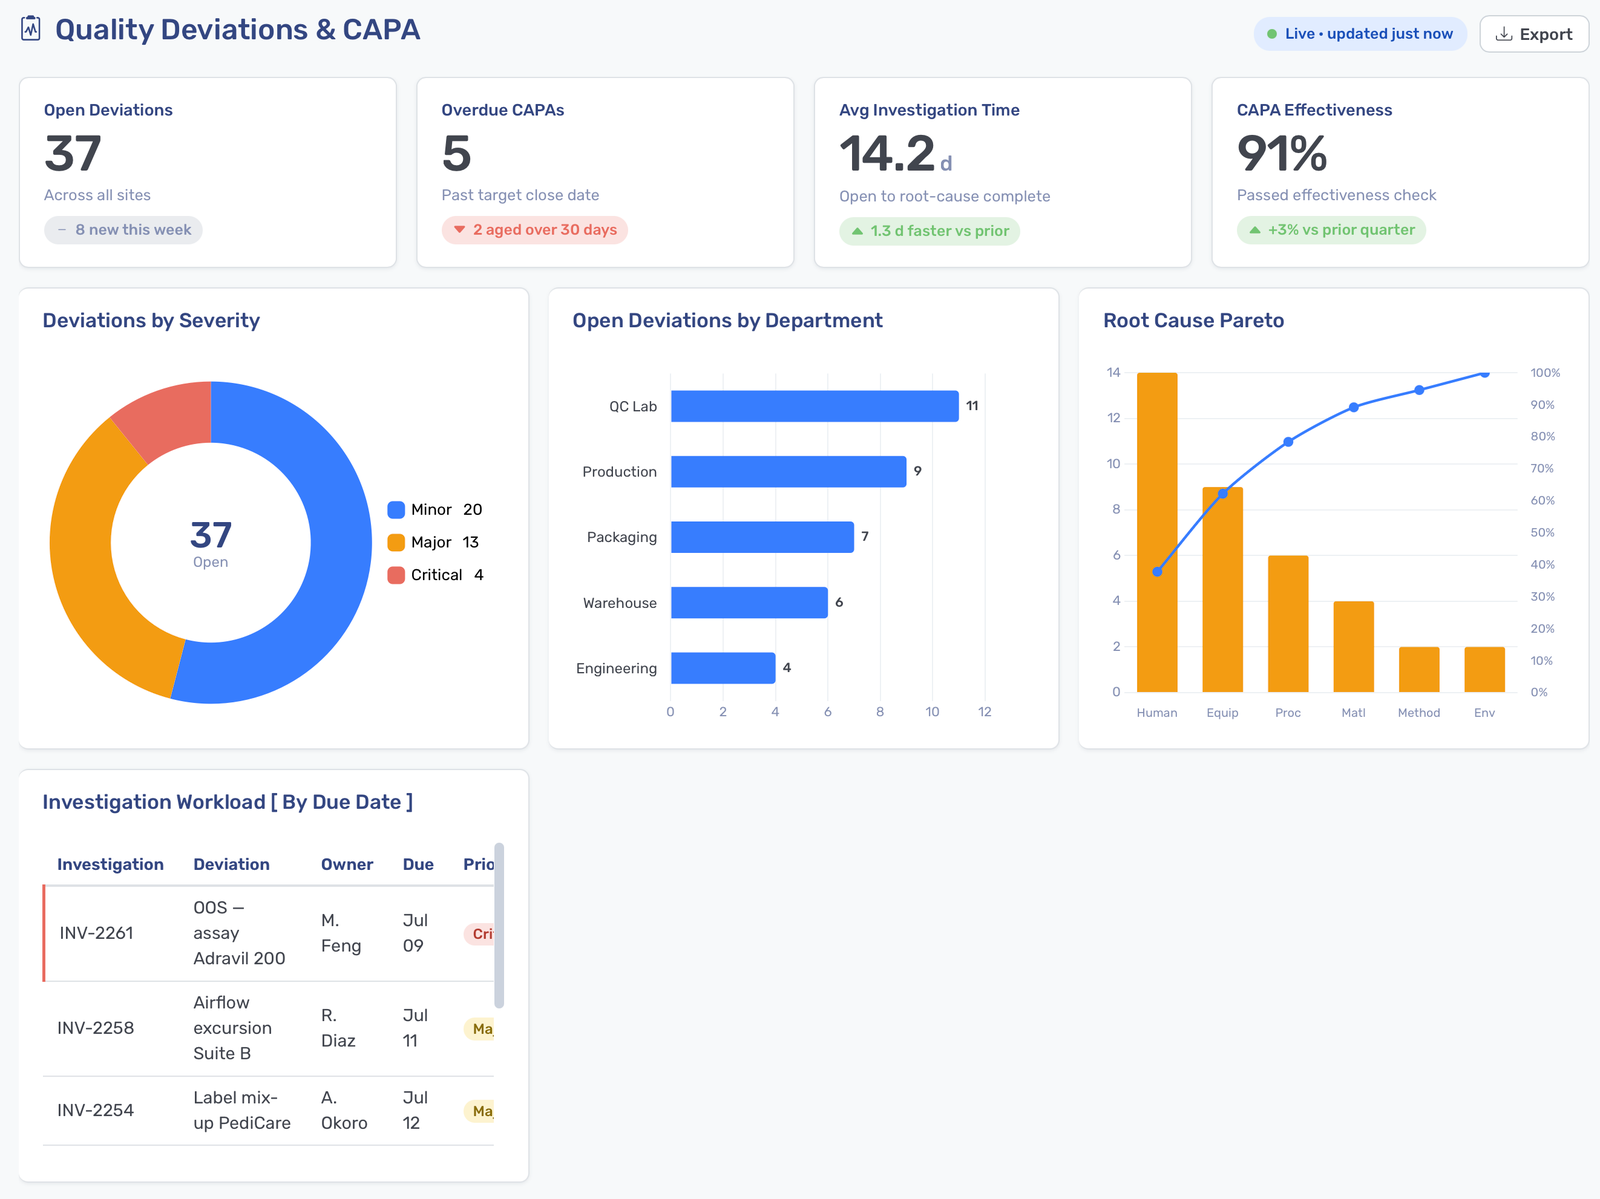
This dashboard gives QA teams a single view of open investigations and the corrective actions associated with them. CAPA effectiveness and deviation aging are two of the most commonly cited gaps during FDA inspections, which makes this dashboard as much a risk-management tool as an operational one.
What it Tracks:
- Open deviations, overdue CAPAs, and average investigation time
- Deviation breakdown by severity, department, and product
- Investigation workload and due dates
- Completed CAPAs and effectiveness checks
- Root cause trends across equipment, department, and suppliers
Who it’s For:
- QA managers monitoring open investigation load
- Compliance officers tracking CAPA aging and effectiveness
- Process engineers identifying recurring equipment or supplier root causes
Dashboard #3: OEE
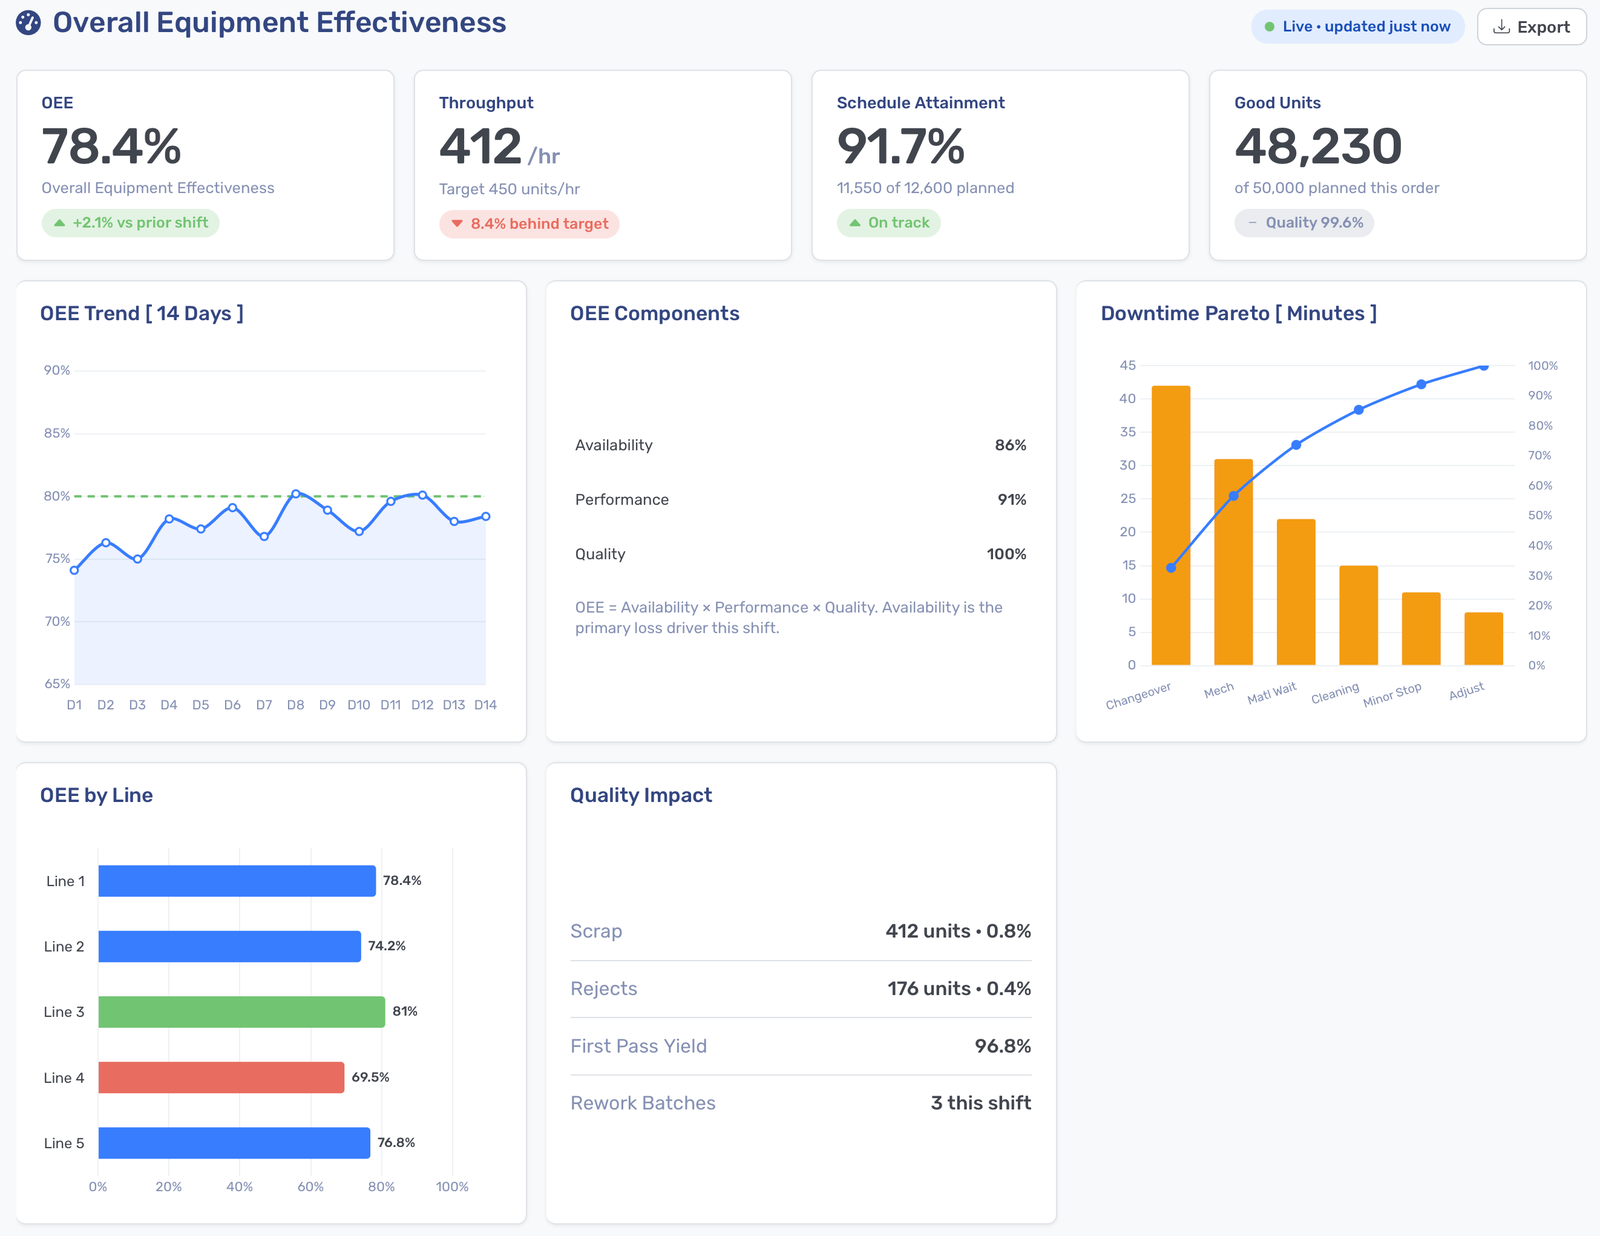
Overall Equipment Effectiveness (OEE) in a life sciences environment carries the same fundamentals as any manufacturing floor—availability, performance, and quality combined into one metric—but the constraint is different. Improving throughput can't come at the expense of quality or regulatory requirements; thus, this dashboard needs to surface quality impact alongside efficiency rather than treating them as separate factors.
What it Tracks:
- OEE and its sub-components
- Downtime analysis by cause and duration
- Equipment-level performance trends
- Quality impact (scrap, rejects, and first pass yield)
- Asset comparison across lines or machines
Who It's For:
- Plant managers balancing throughput against compliance risk
- Maintenance teams correlating equipment condition with performance loss
- Operations leaders comparing OEE across lines or sites
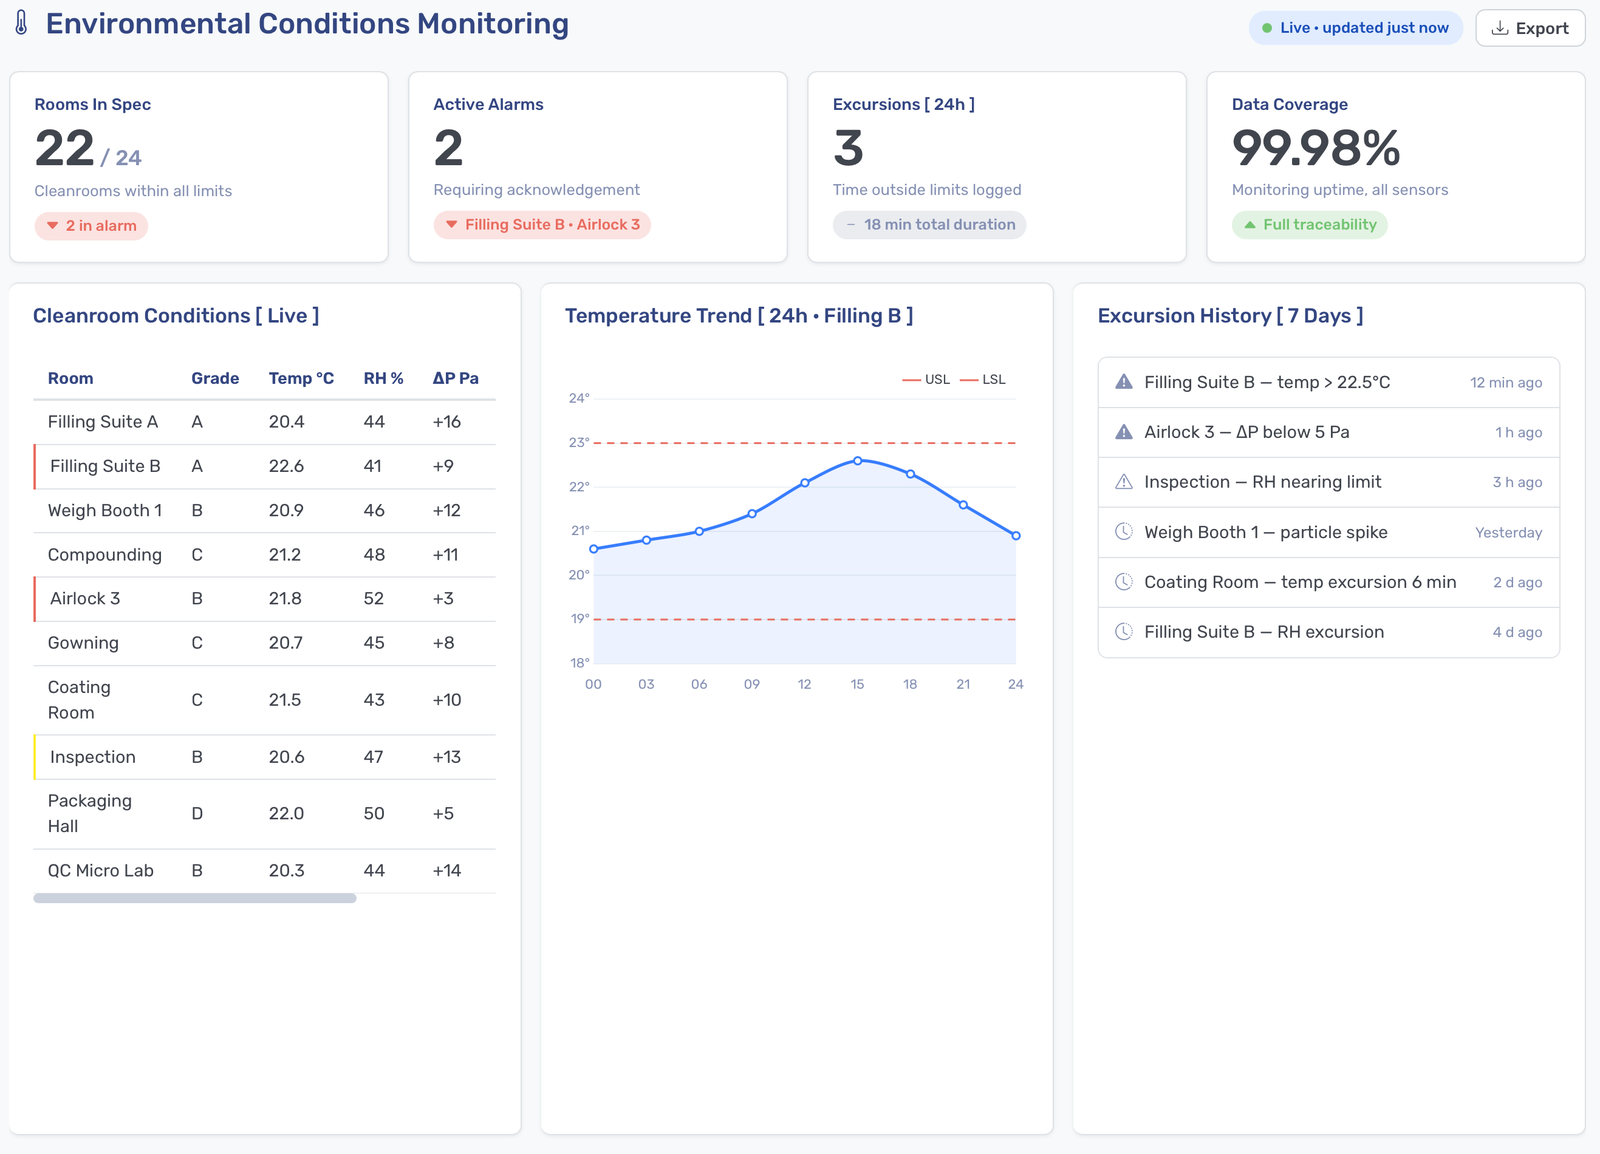
Dashboard #4: Environmental Conditions Monitoring
In cleanrooms and controlled environments, effective, real-time visibility isn’t optional—this type of dashboard is critical. For example, a temperature or humidity excursion outside validated limits can compromise an entire batch, and the record of that excursion must exist, even if no one was watching the dashboard when it occurred.
What it Tracks:
- Cleanroom conditions (temperature, humidity, airflow, and related parameters)
- Real-time alarm status
- Excursion history, including time outside limits and affected rooms
- Trend analysis across historical performance, seasonal patterns, and high-risk areas
Who It's For:
- Facilities and environmental monitoring teams
- QA teams evaluating whether an excursion affected production
- Validation engineers tracking long-term environmental stability
Dashboard #5: Audit Readiness & Review by Exception
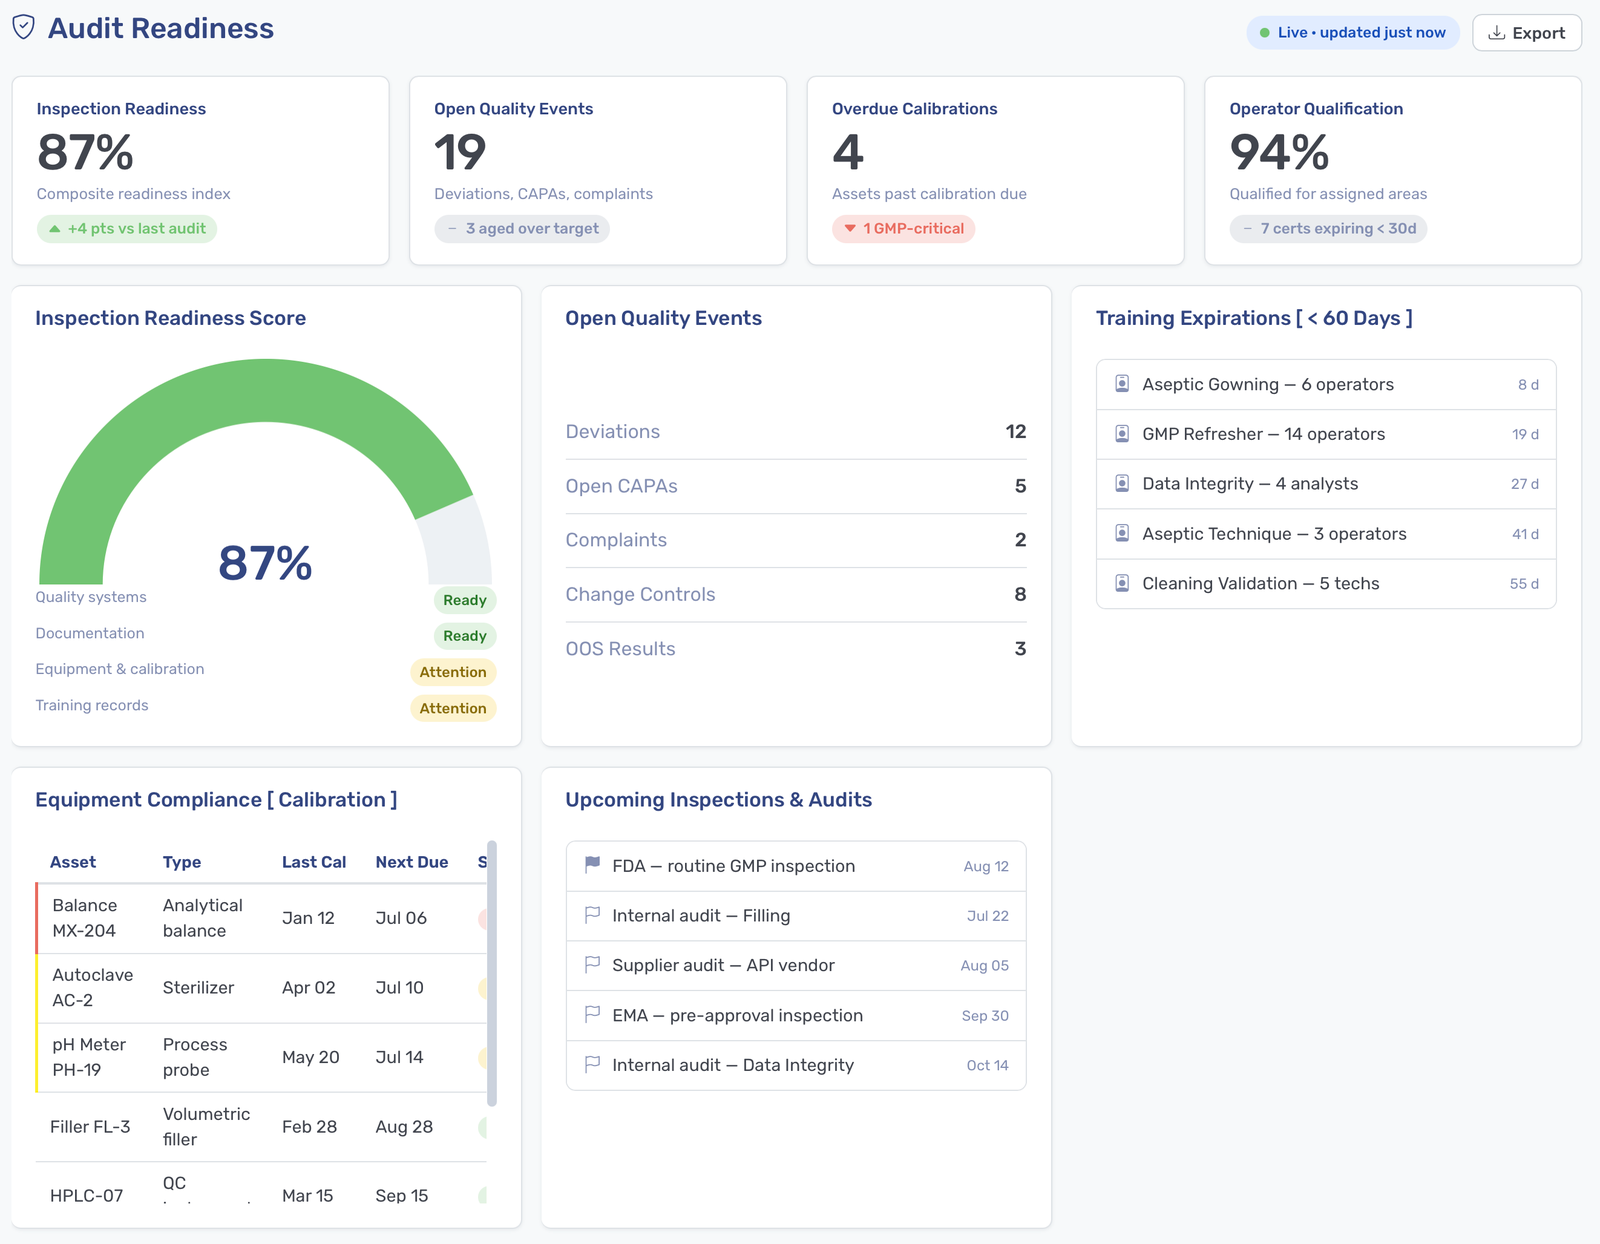
This dashboard answers a common question among QA professionals: if an inspector walked in today, would we be ready? It brings together open quality events, EBR status, equipment compliance, traceability, and more into a single view, so finding the answer doesn't require tracking down data from various systems.
It also supports review by exception. This shifts batch review away from checking every field of every record and toward flagging only the documentation, processes, or approval exceptions that actually need a reviewer's attention, which can reduce batch release time when executed correctly.
What It Tracks:
- Open quality events and EBR status, including batches awaiting review or missing electronic signatures
- Training and qualification status, including upcoming certification expirations and percentage of qualified operators by area
- Equipment compliance (assets overdue for calibration or upcoming servicing)
- Material traceability completeness and recall readiness indicators
- Upcoming inspections and internal audit timelines
- Documentation and process exceptions with approval status and trend tracking
Who It's For:
- QA directors preparing for inspections
- Batch reviewers working through review-by-exception queues
- Training coordinators tracking certification expirations across shifts
Dashboard #6: Batch Release Readiness
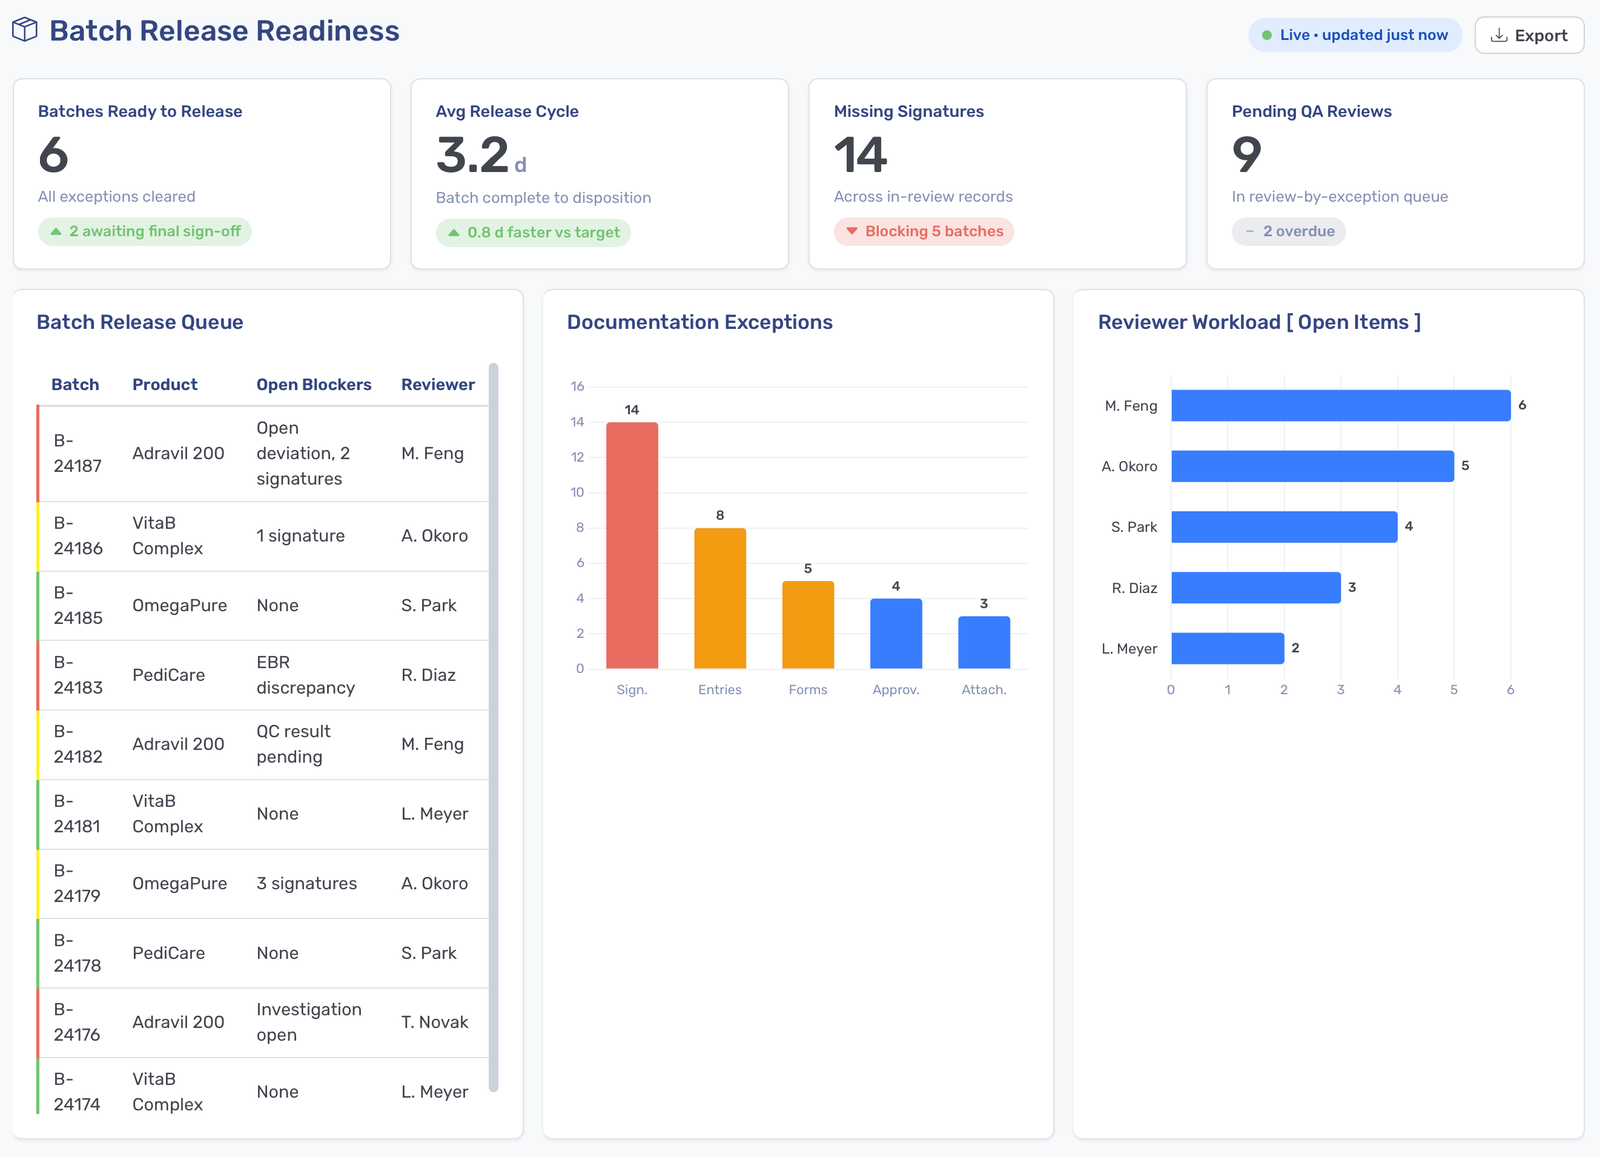
Batch release is often the single slowest step between a completed run and a shippable product, and the delay is rarely due to the manufacturing itself; it’s caused by the documentation supporting it. This dashboard gives QA teams a direct view into exactly what's holding back an unreleased batch.
What It Tracks:
- Documentation status, including missing signatures and approvals
- Quality review queue, including pending reviews and workload by reviewer
- Exception status, including open deviations and pending investigations
Who It's For:
- QA teams working to reduce batch release cycle time
- Batch reviewers managing their own review queue
- Plant managers tracking release timelines against production schedules
Dashboard #7: Asset Health & Maintenance
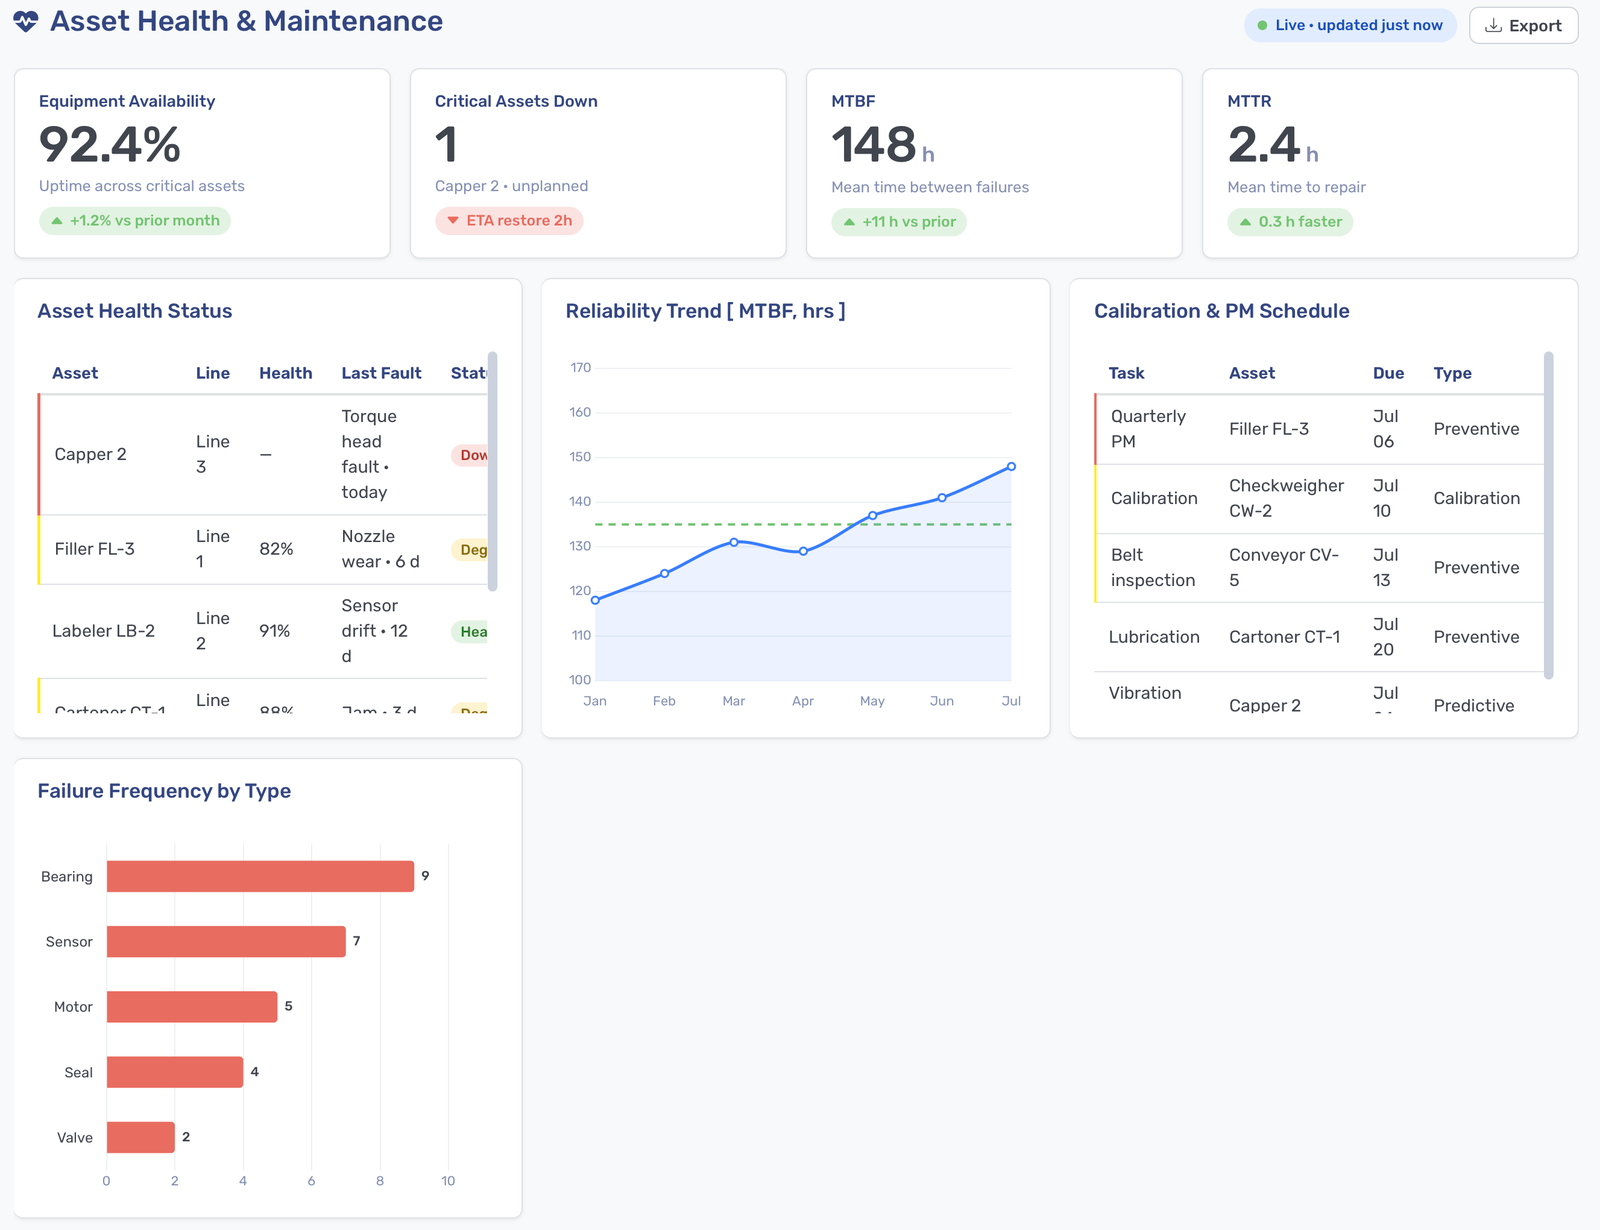
Equipment reliability and regulatory compliance are more closely connected in life sciences manufacturing than other industries, because an overdue calibration doesn’t just risk a breakdown—it can invalidate the data that piece of equipment generates. This dashboard treats maintenance and calibration status as one connected picture rather than separate systems.
What It Tracks:
- Equipment availability and critical asset downtime
- Maintenance status across scheduled and unscheduled work
- Calibration calendars, overdue service, and upcoming service dates
- Equipment reliability metrics (MTBR, MTTR, and failure frequency)
- Predictive maintenance indicators and trends
Who It's For:
- Maintenance managers monitoring schedules
- Reliability engineers tracking failure trends by asset
- QA teams confirming equipment compliance ahead of an audit
Dashboard #8: Process Performance & SPC
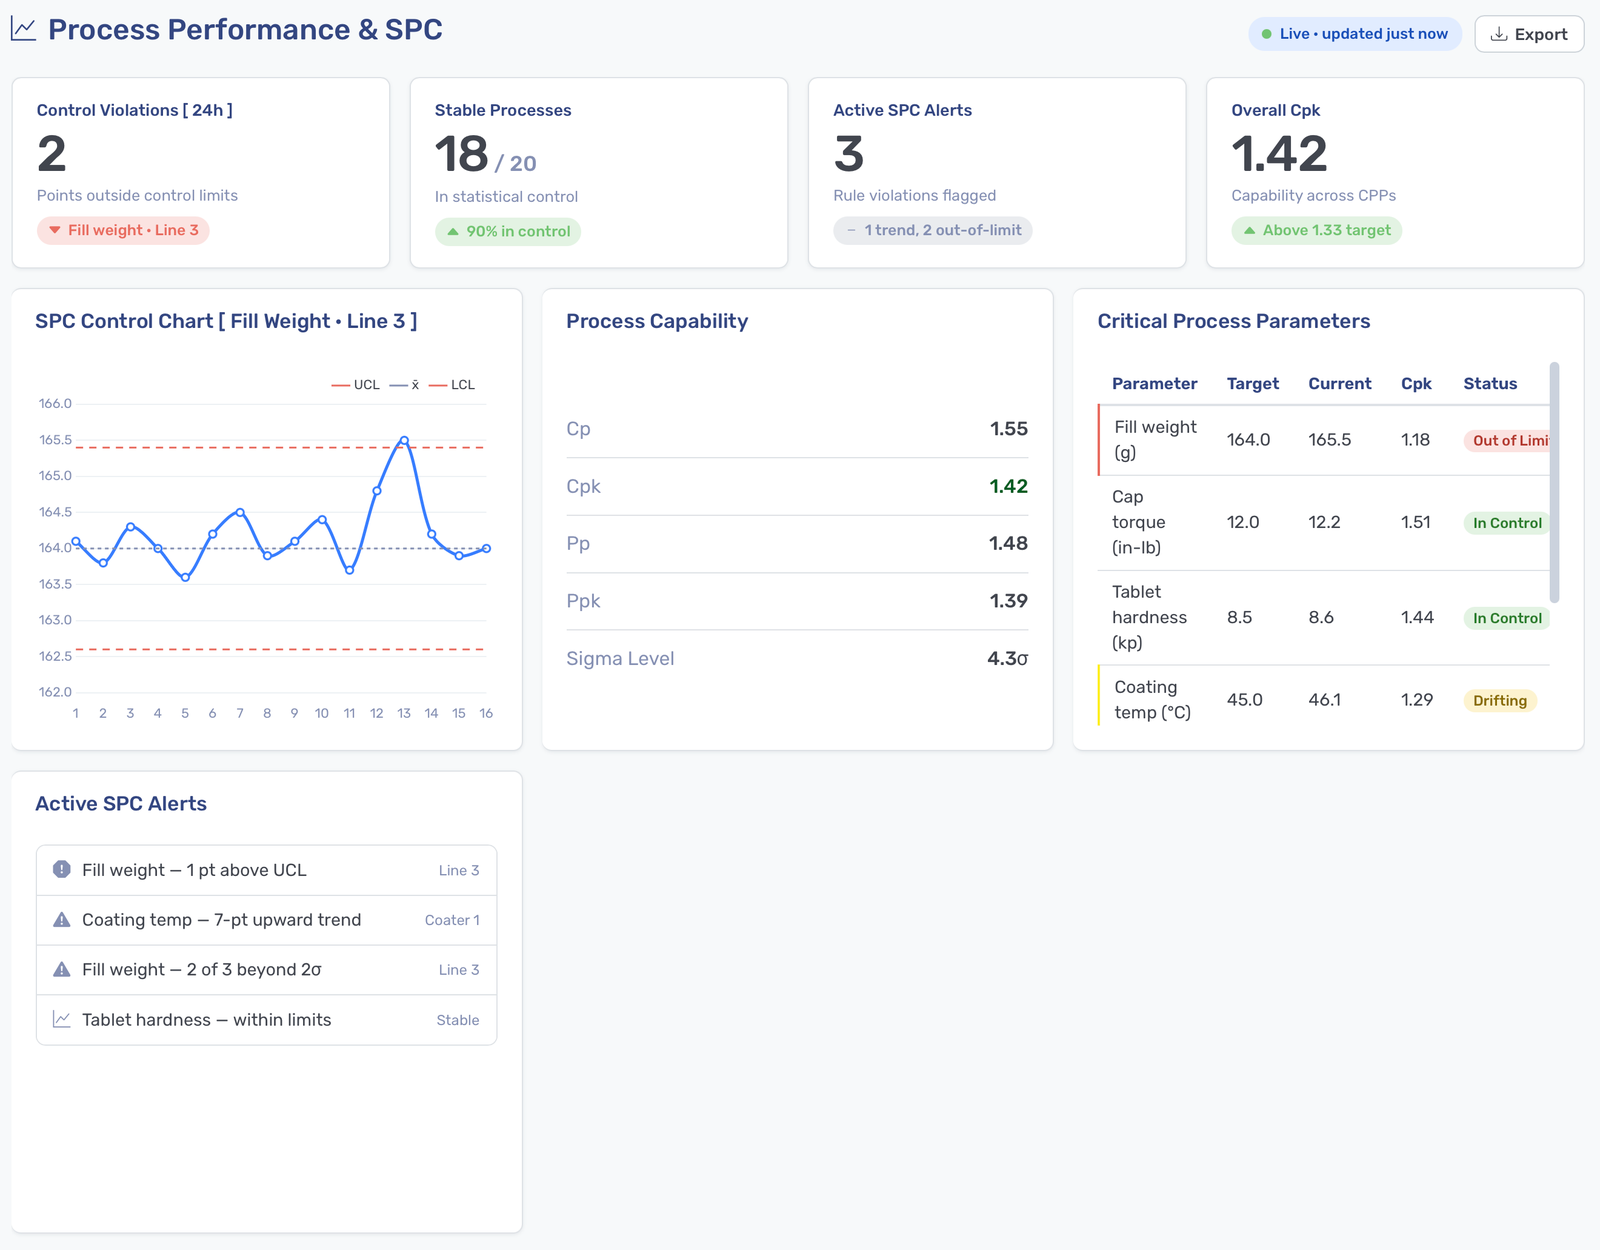
Statistical Process Control (SPC) exists to catch drift before it becomes deviation, and this dashboard is where that detection happens. Rather than waiting for a batch to fail specification, teams can see a critical process parameter trending toward a control limit and intervene before output is affected.
What It Tracks:
- Overall summary of control limit violations, stable processes, and active alerts
- SPC charts for critical process parameters
- Critical process parameters such as temperature, pressure, and pH
- Long-term process drift trends and predictive warnings
Who It's For:
- Process engineers monitoring parameter stability
- QA teams investigating trends before they become deviations
- Validation teams confirming a process remains in its qualified state
Conclusion
In a regulated environment, visibility isn't just about running production more efficiently; it's about being able to prove at any moment that a batch is exactly what the records say it is.
These eight TrakSYS dashboards highlight the areas where that proof matters most: batch quality, deviation management, equipment reliability, environmental control, and audit readiness. Built on real-time data captured directly from the shop floor and quality systems, they turn hours of manual reporting and pre-audit scrambling into a view that's already accurate.
Ready to hear more about how TrakSYS dashboards can bring powerful visibility to your life sciences operation? Contact us today.
FAQs
Related Blog Posts
.png)
.png)
.png)
.png)
.png)


Let’s Build Your Plan
We’ll help you create the right configuration—today and for the future.